Fink data statistics
Portal
Check out the new page about Fink processed data statistics on the Science Portal: heatmap, daily statistics, timelines, and more! These statistics are updated once a day, after the ZTF observing night.
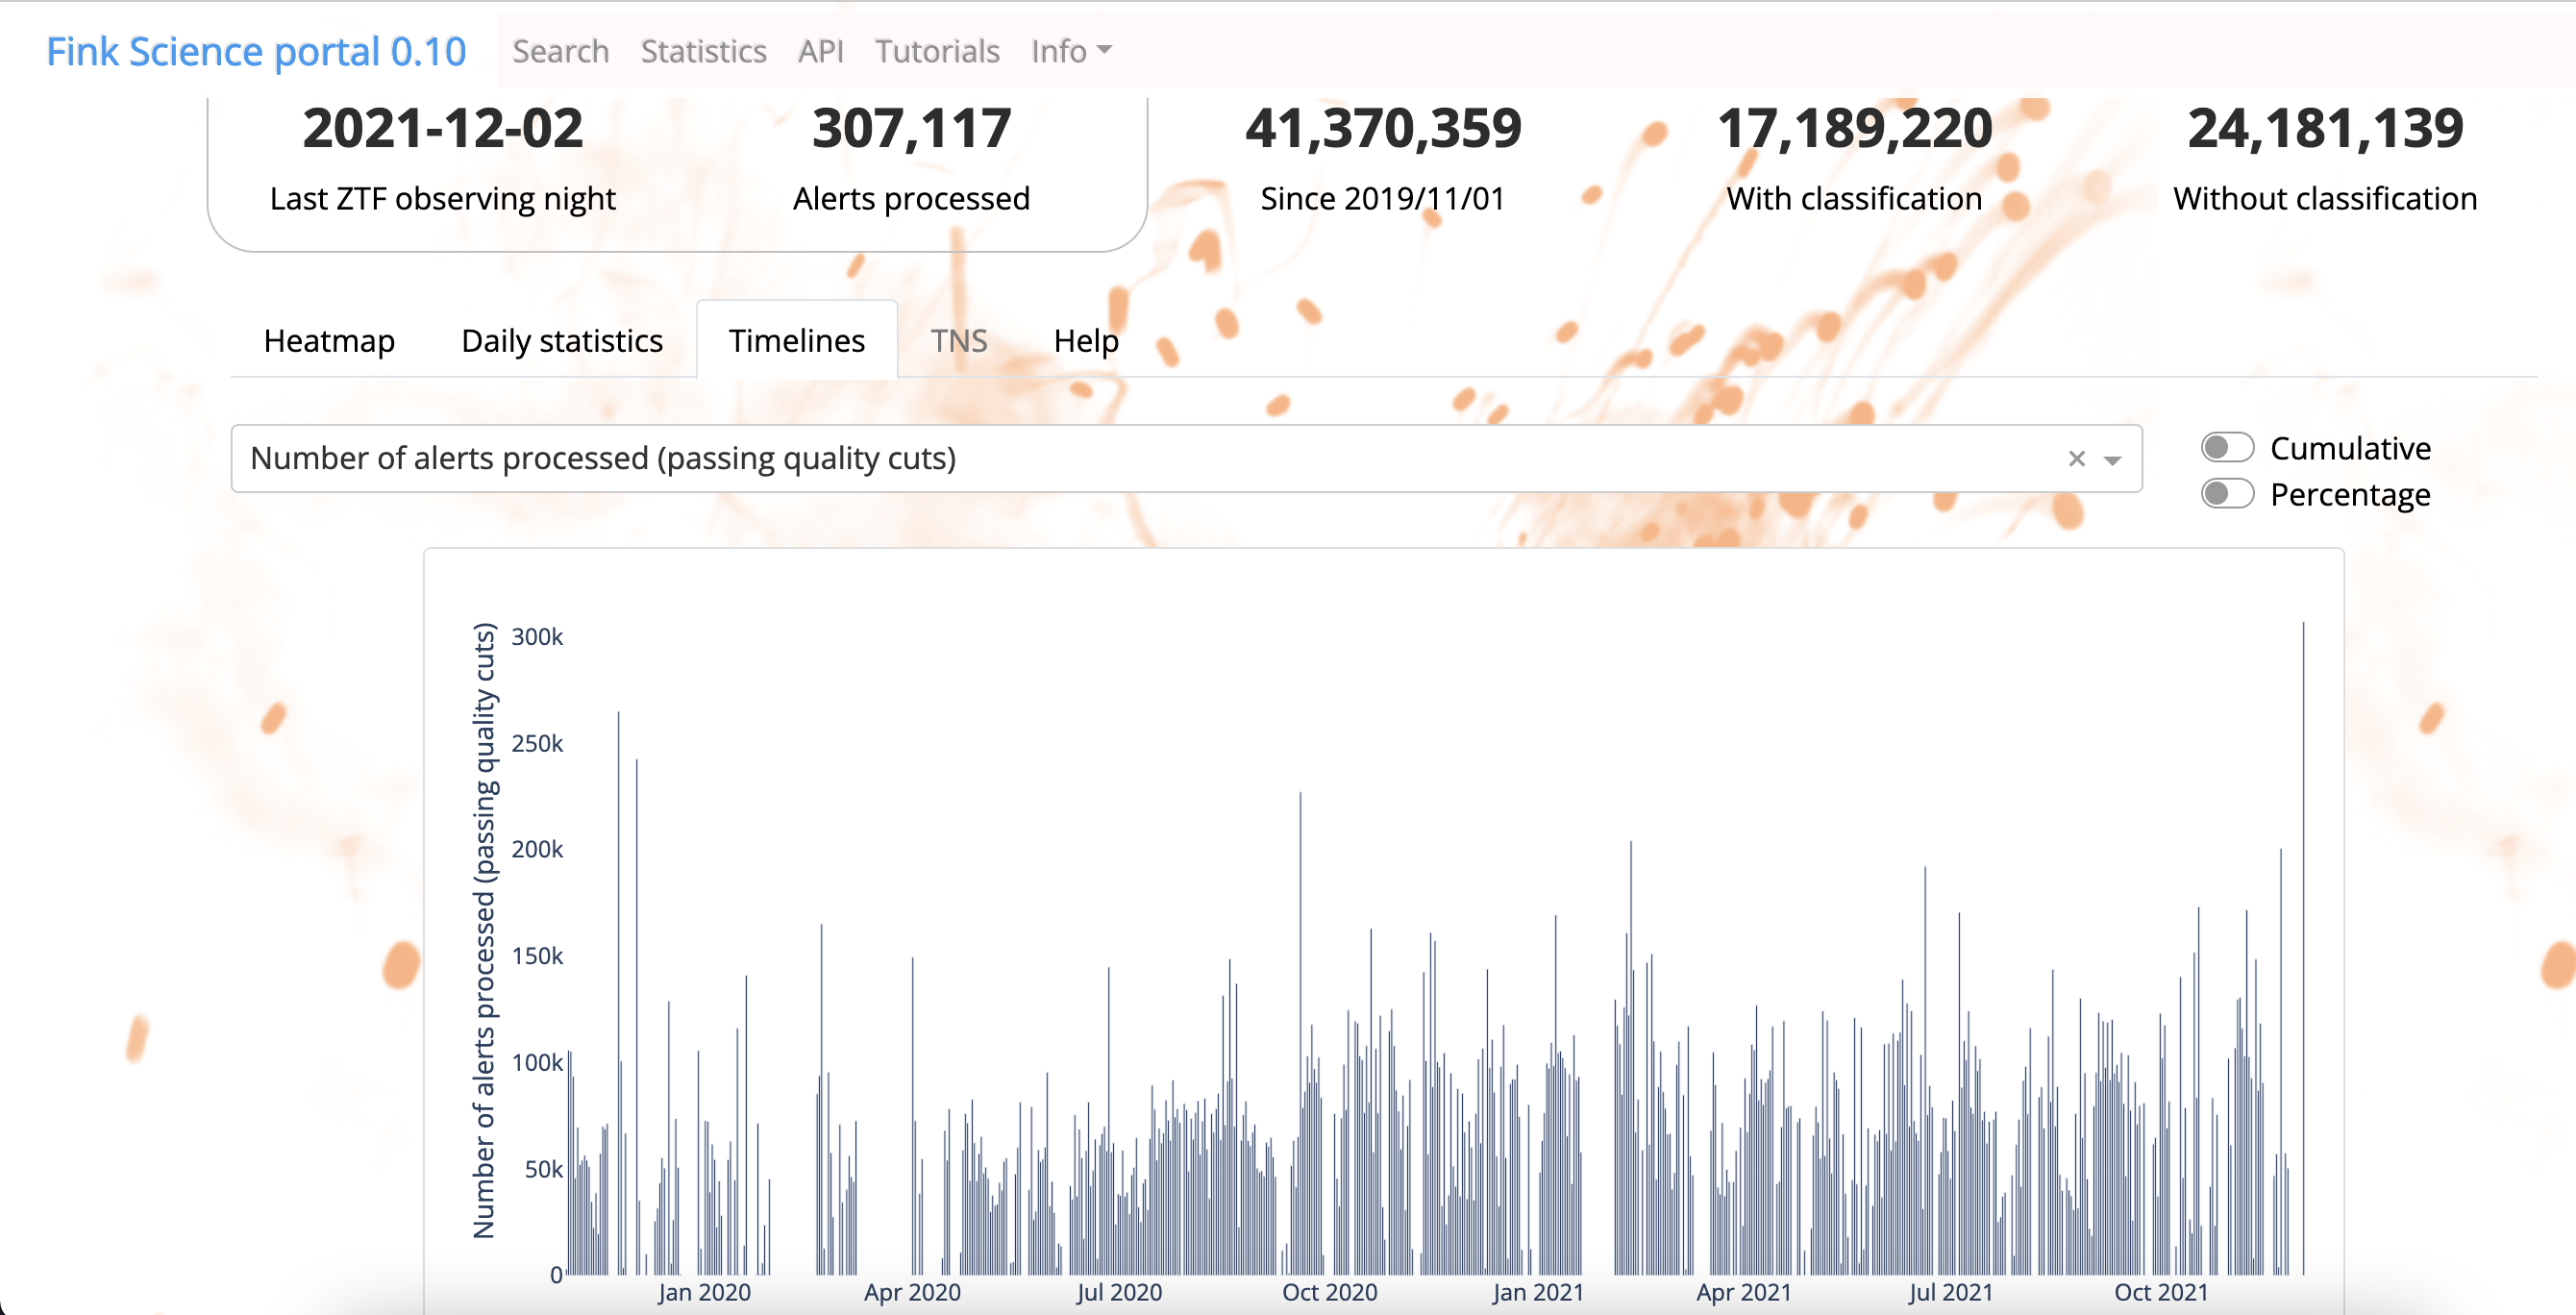
 The header tells you about the last night we had data, the number of processed alerts for this night, the total number of processed alerts since 2019/11/01, as well as how many got a label by Fink.
Heatmap
The Heatmap tab shows the number of alerts processed by Fink for each night
since the beginning of our operations (2019/11/01). The graph is color coded,
dark cells represent a low number of processed alerts, while bright cells represent
a high number of processed alerts.
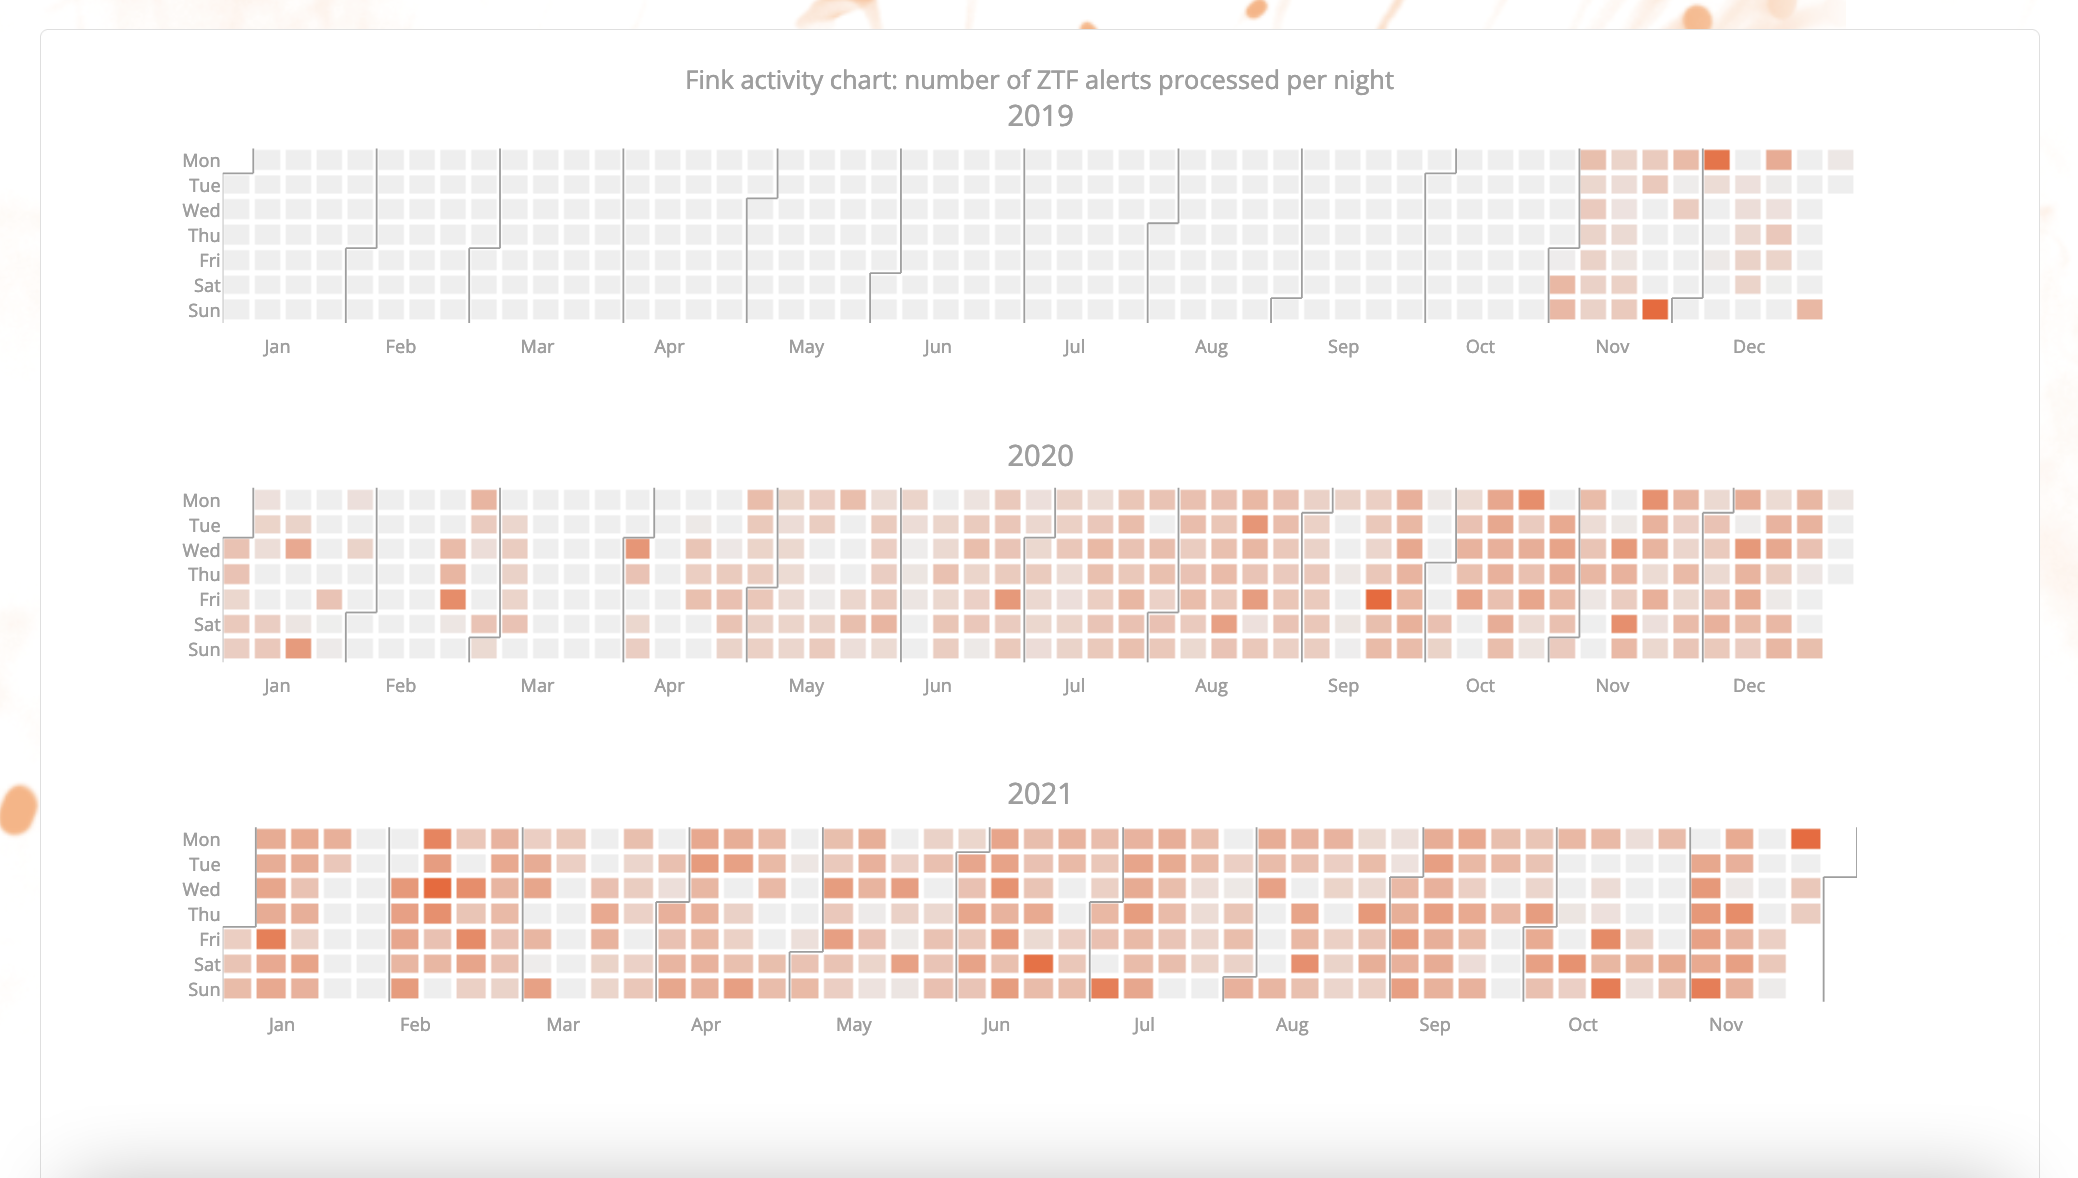 Heatmap à la GitHub!
Daily statistics
The Daily statistics tab shows various statistics for a given observing night.
The first row shows histograms for various indicators:
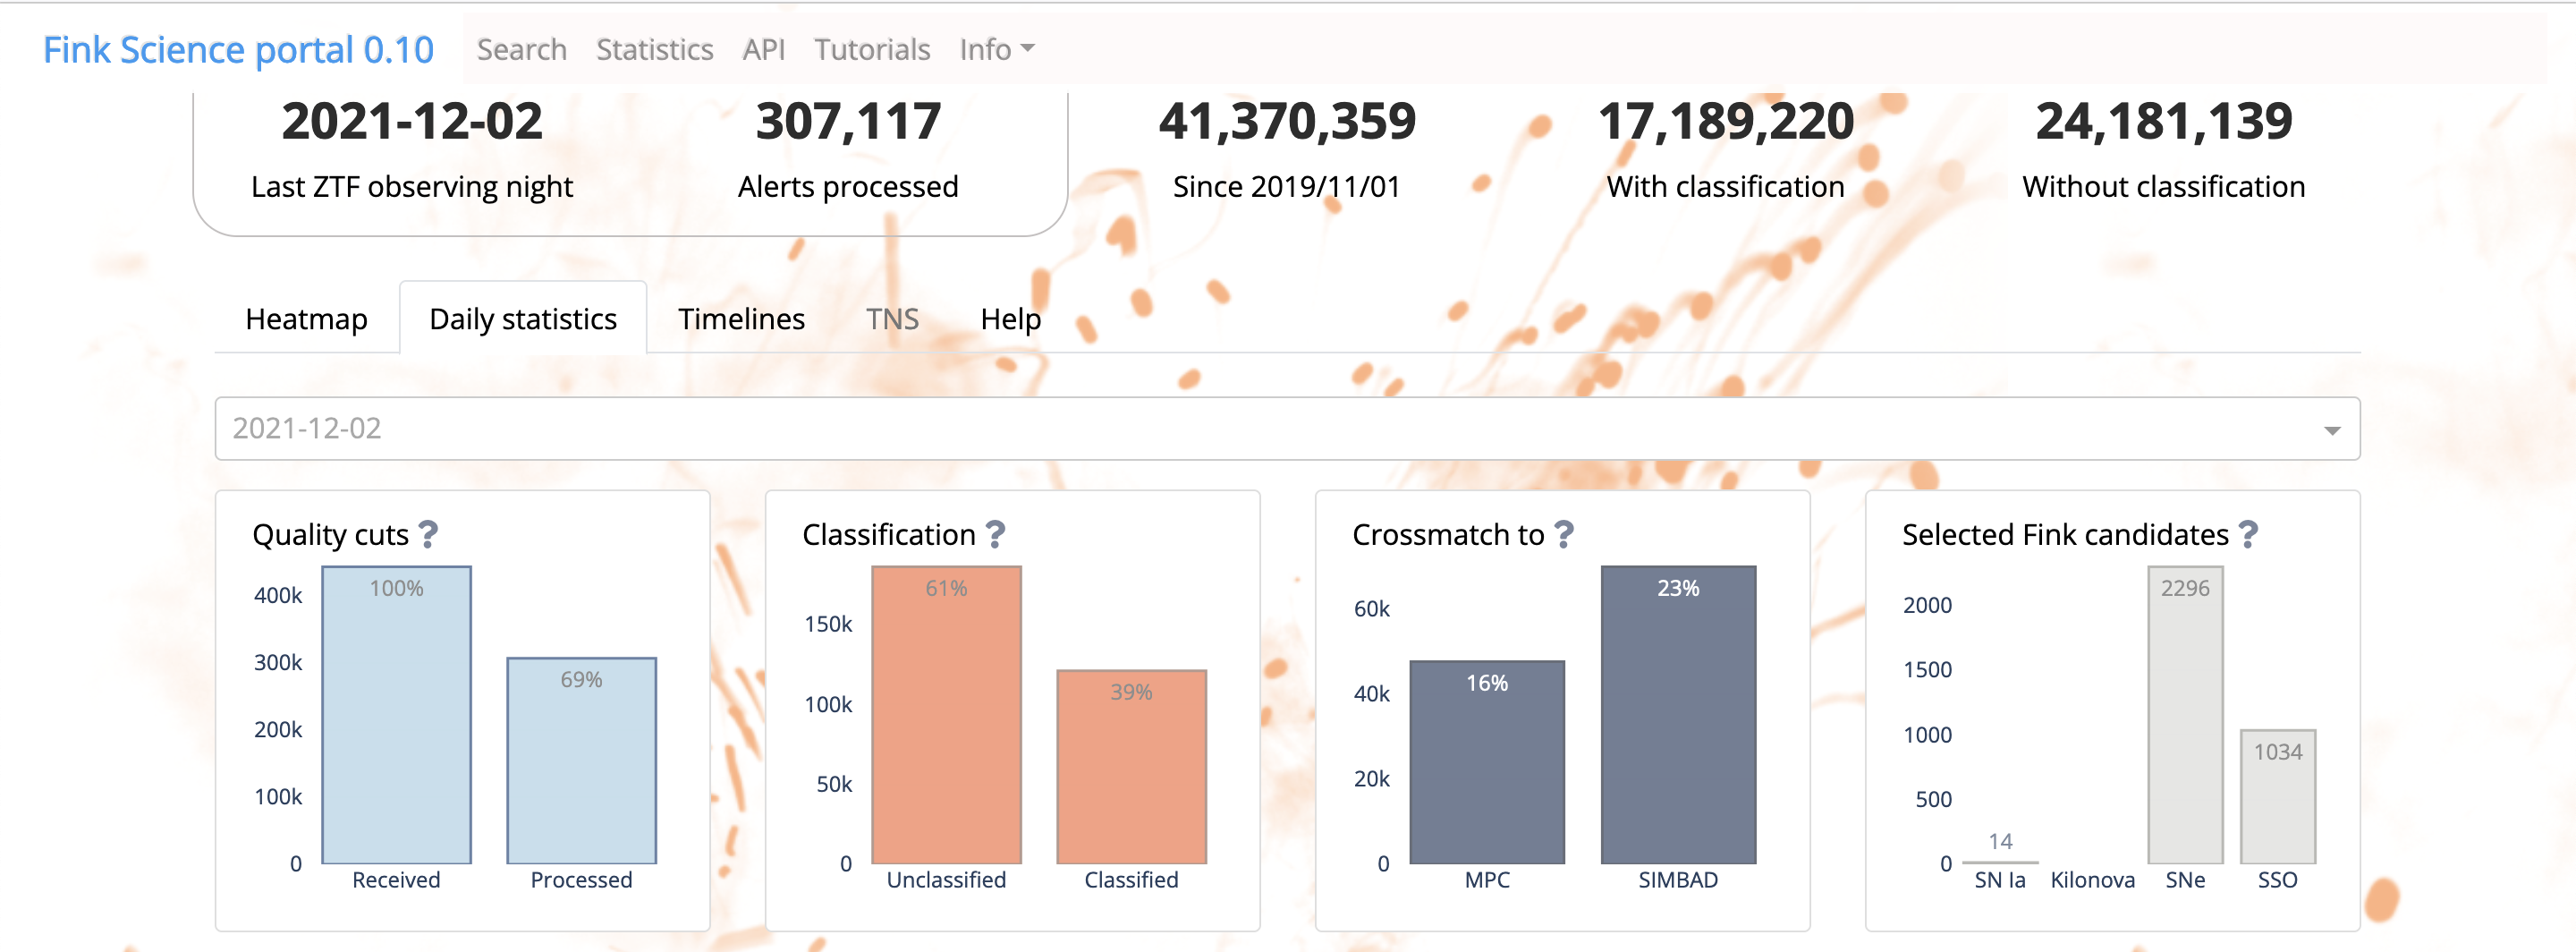
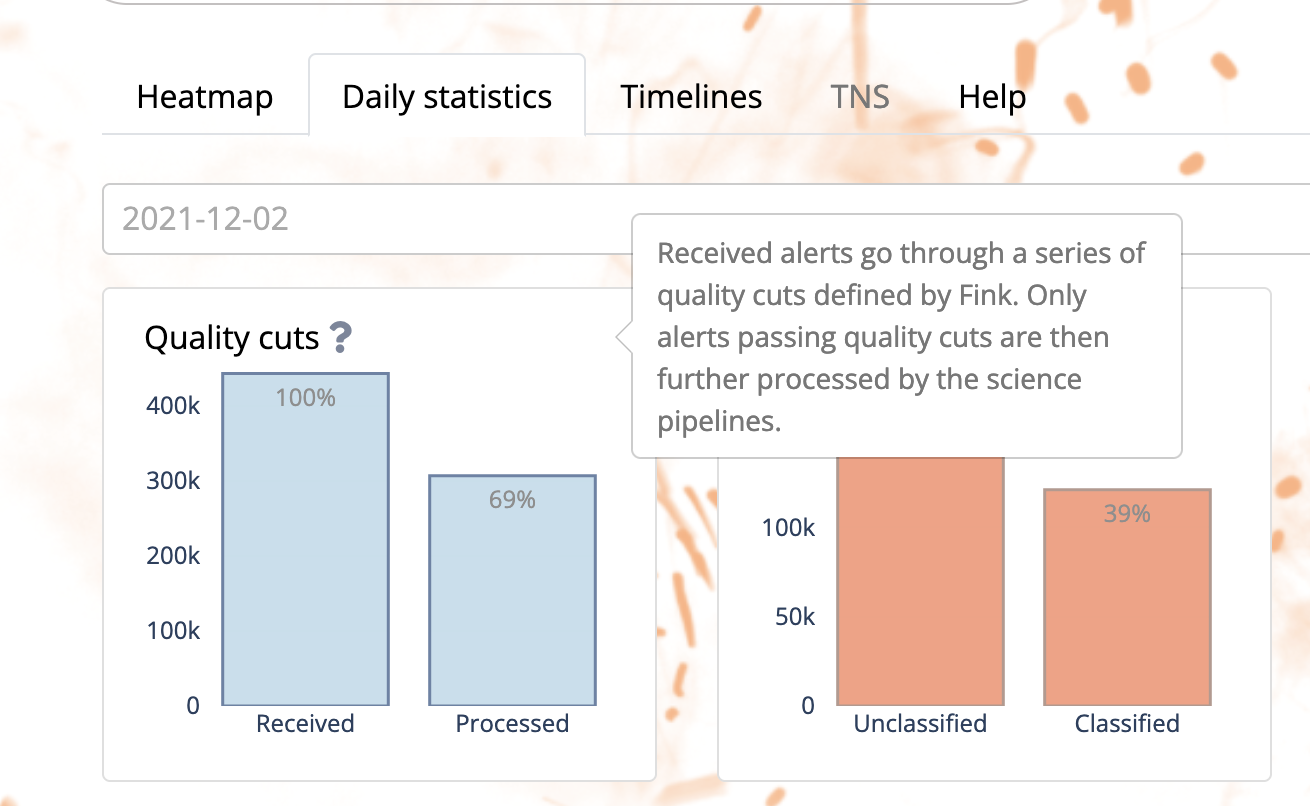
- Quality cuts: difference between number of received alerts versus number of processed alerts. The difference is simmply due to the quality cuts in Fink selecting only the best quality alerts.
- Classification: Number of alerts that receive a tag by Fink, either from the Machine Learning classifiers, or from a crossmatch with catalogs. The rest is “unclassified”.
- External catalogs: Number of alerts that have a counterpart either in the MPC catalog or in the SIMBAD database.
- Selected candidates: Number of alerts for a subset of classes: early type Ia supernova (SN Ia), supernovae or core-collapse (SNe), Kilonova, or Solar System candidates.
You get help about the content by hovering the [?]:
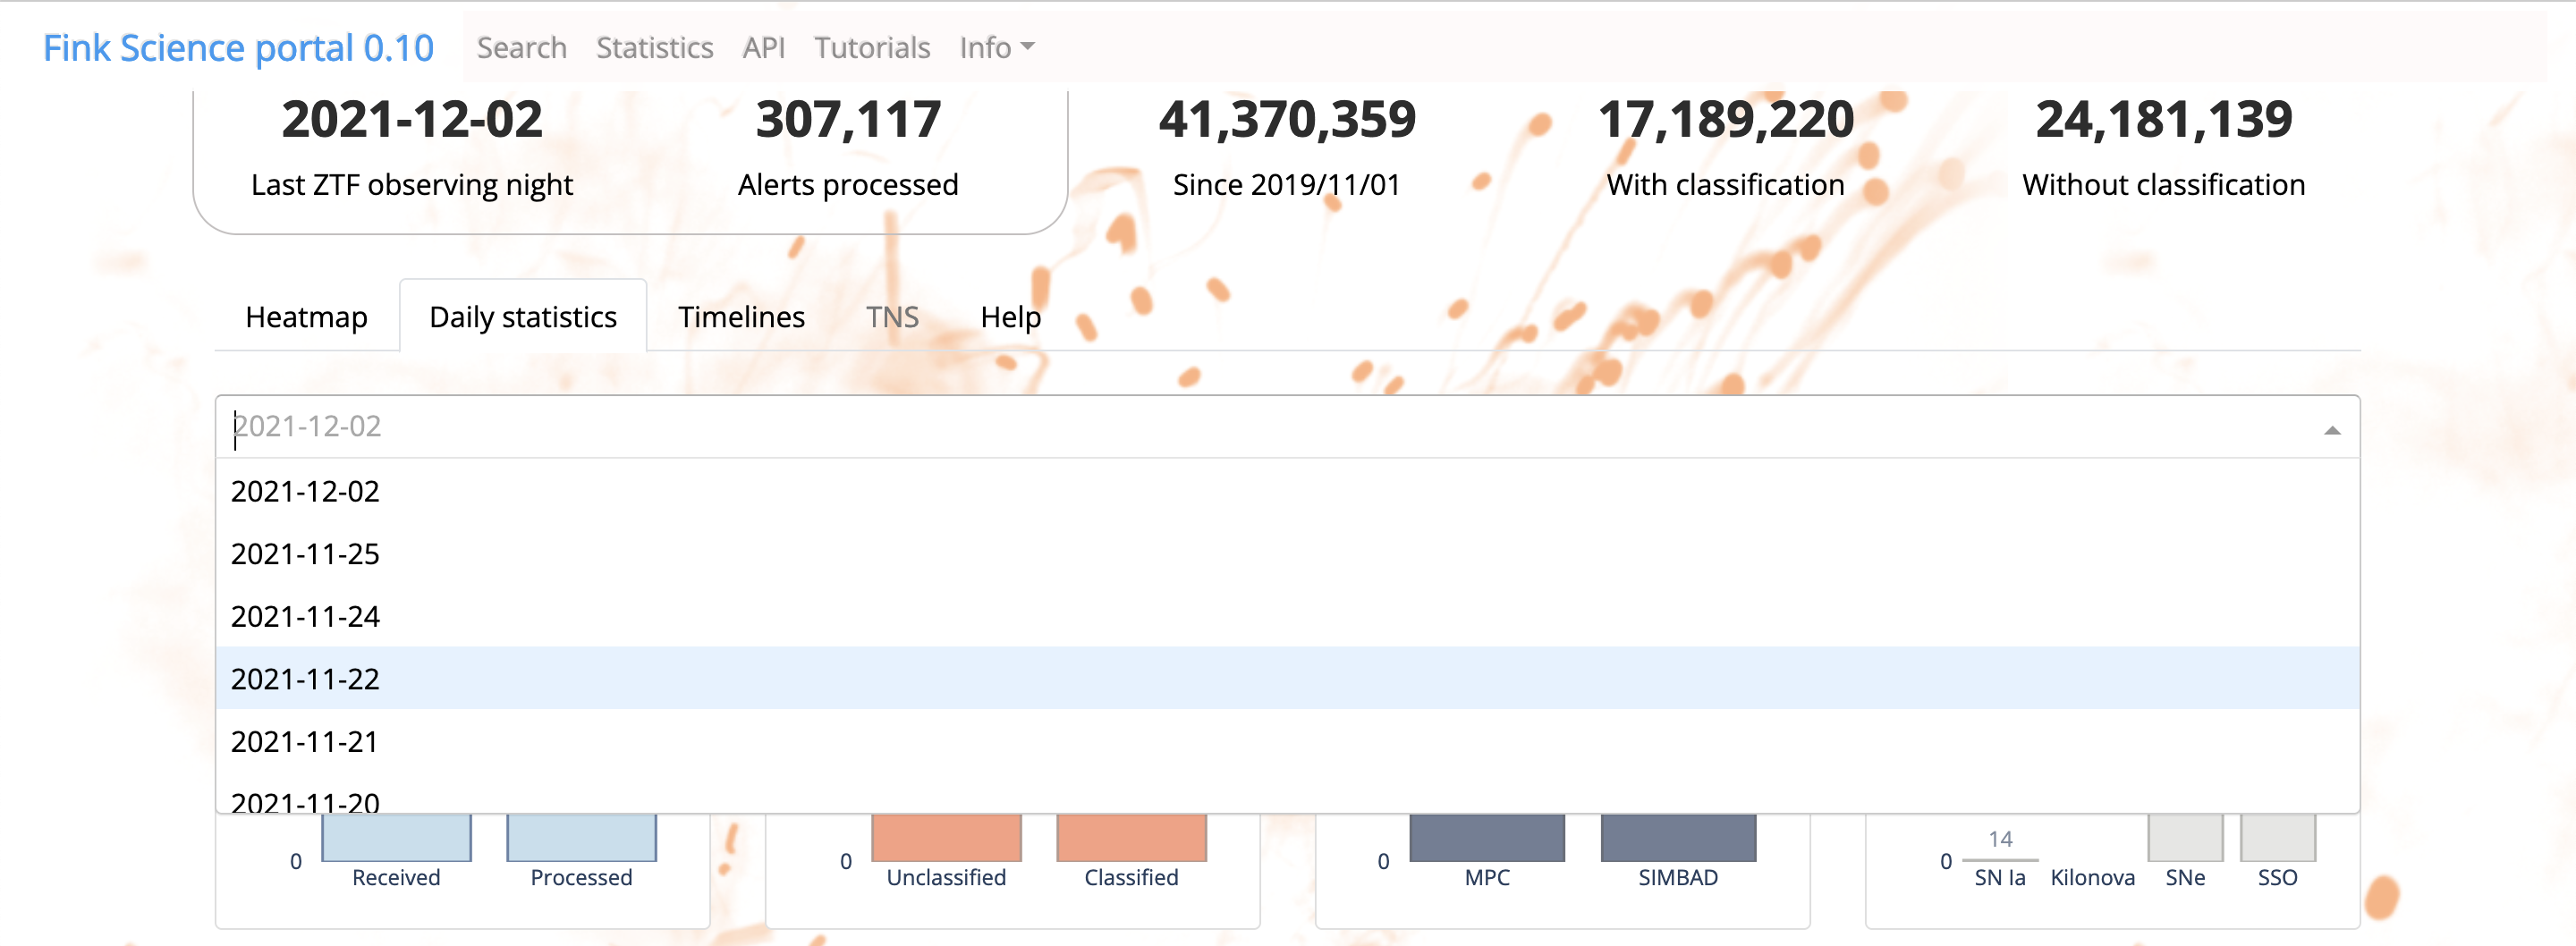
By default, we show the last observing night. You can change the night by using the dropdown button:
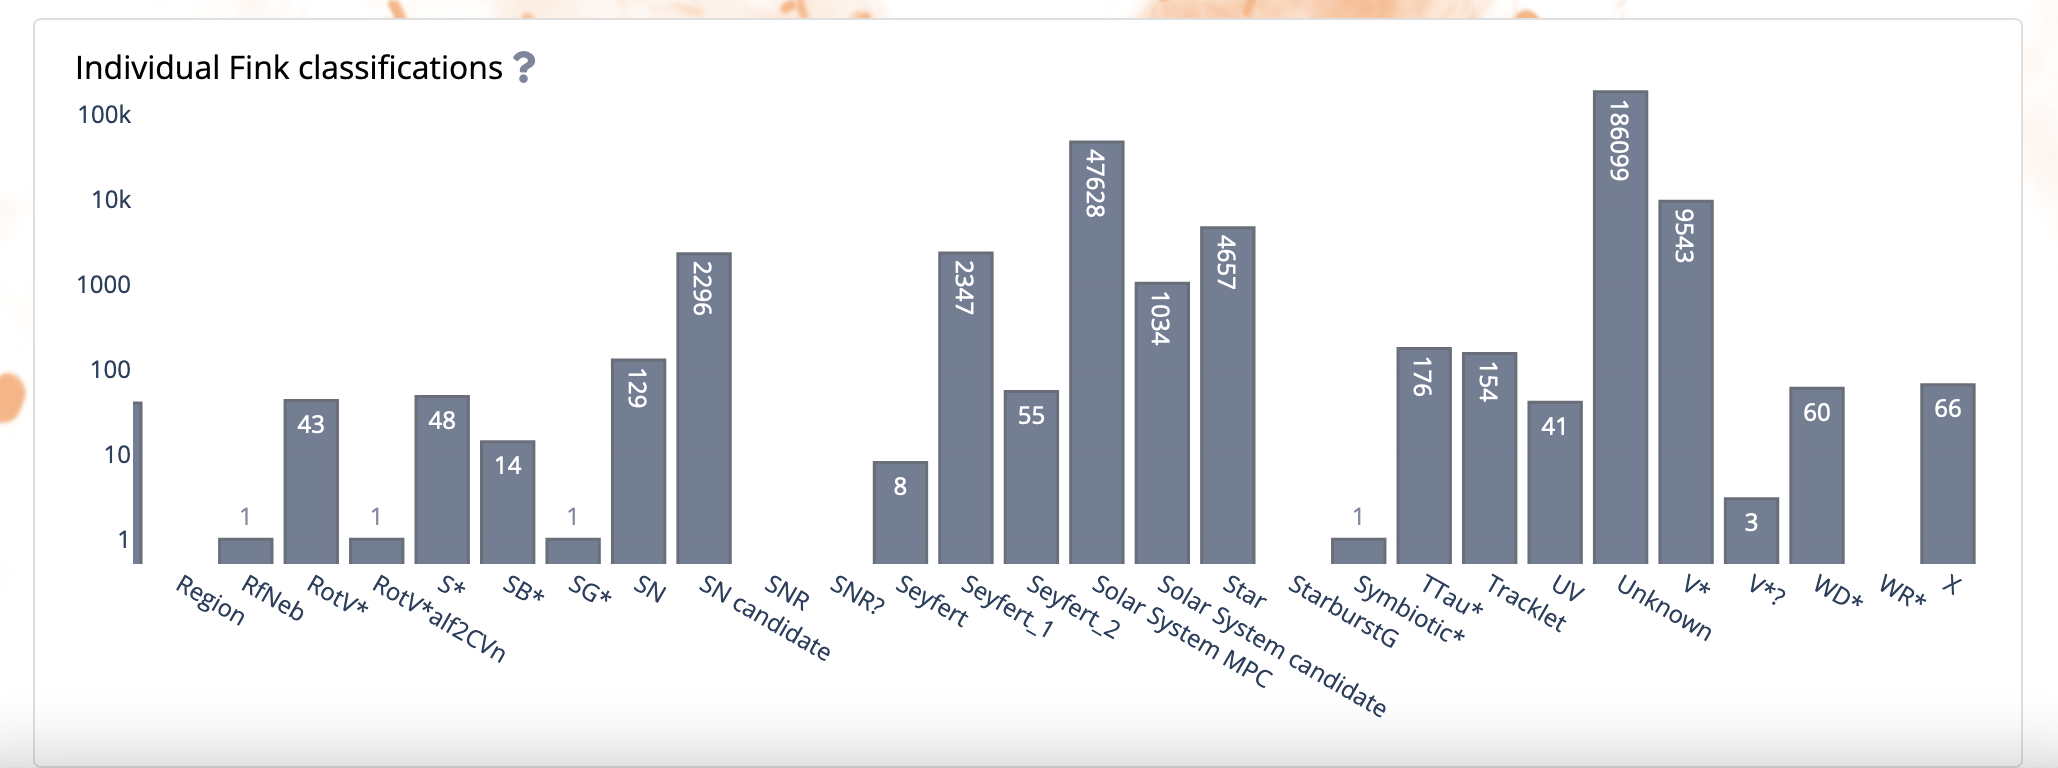
The second row shows the number of alerts for all labels in Fink (from classifiers or crossmatch):
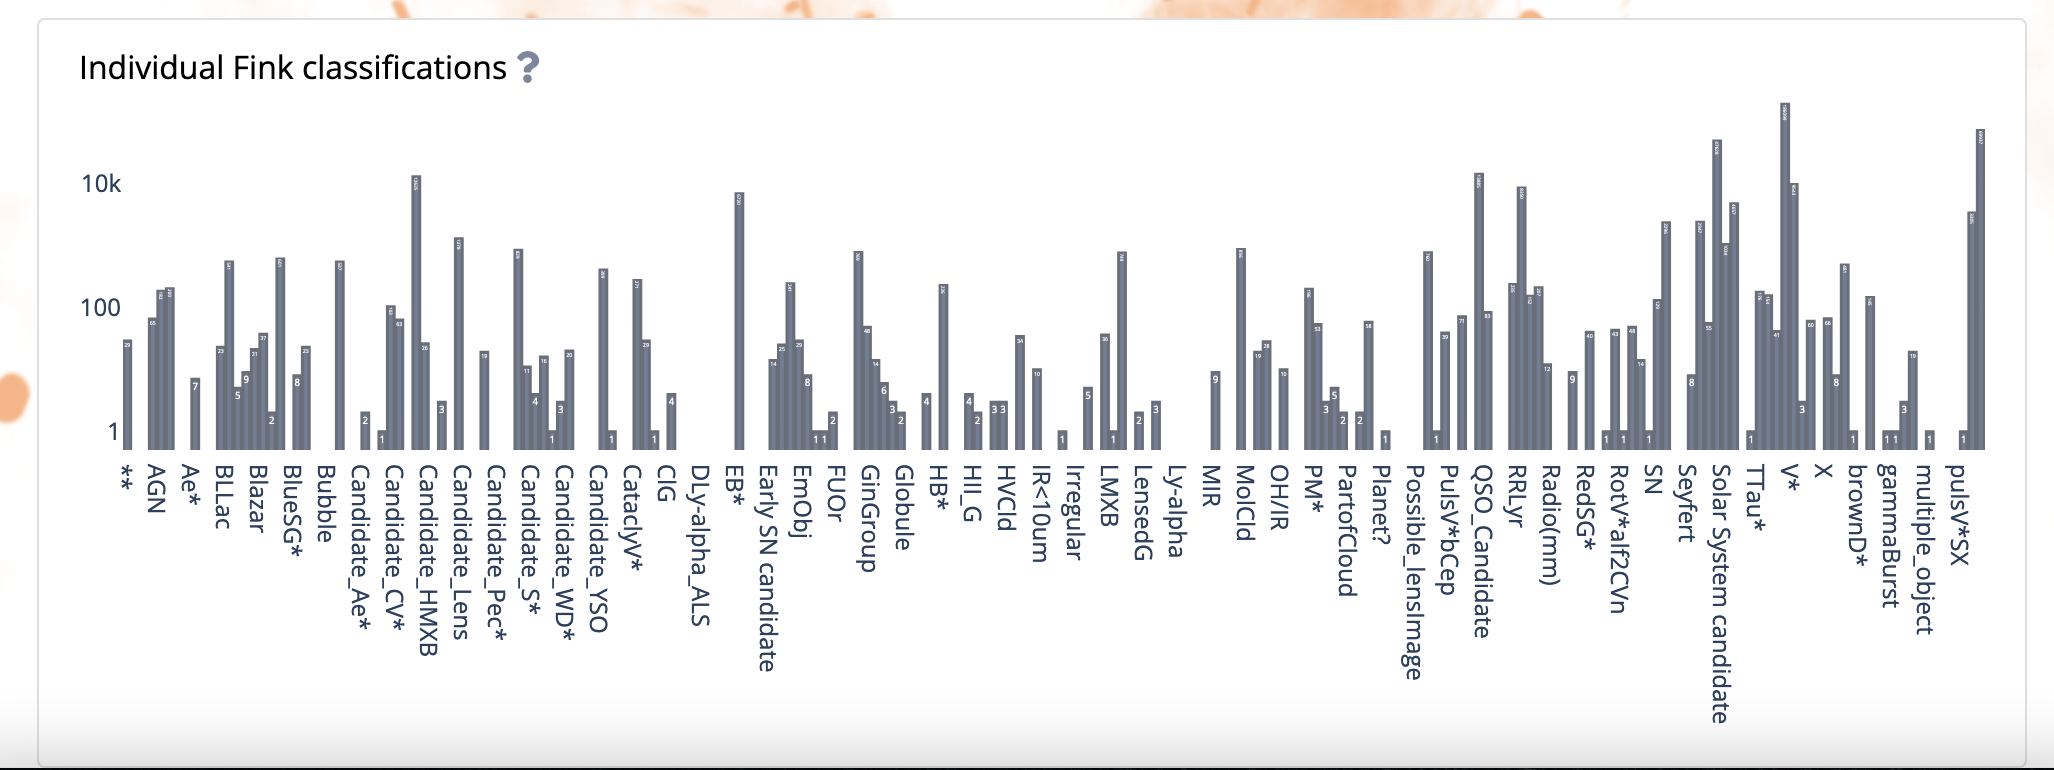
Since there are many labels available, do not hesitate to zoom in to see more details!
Timelines
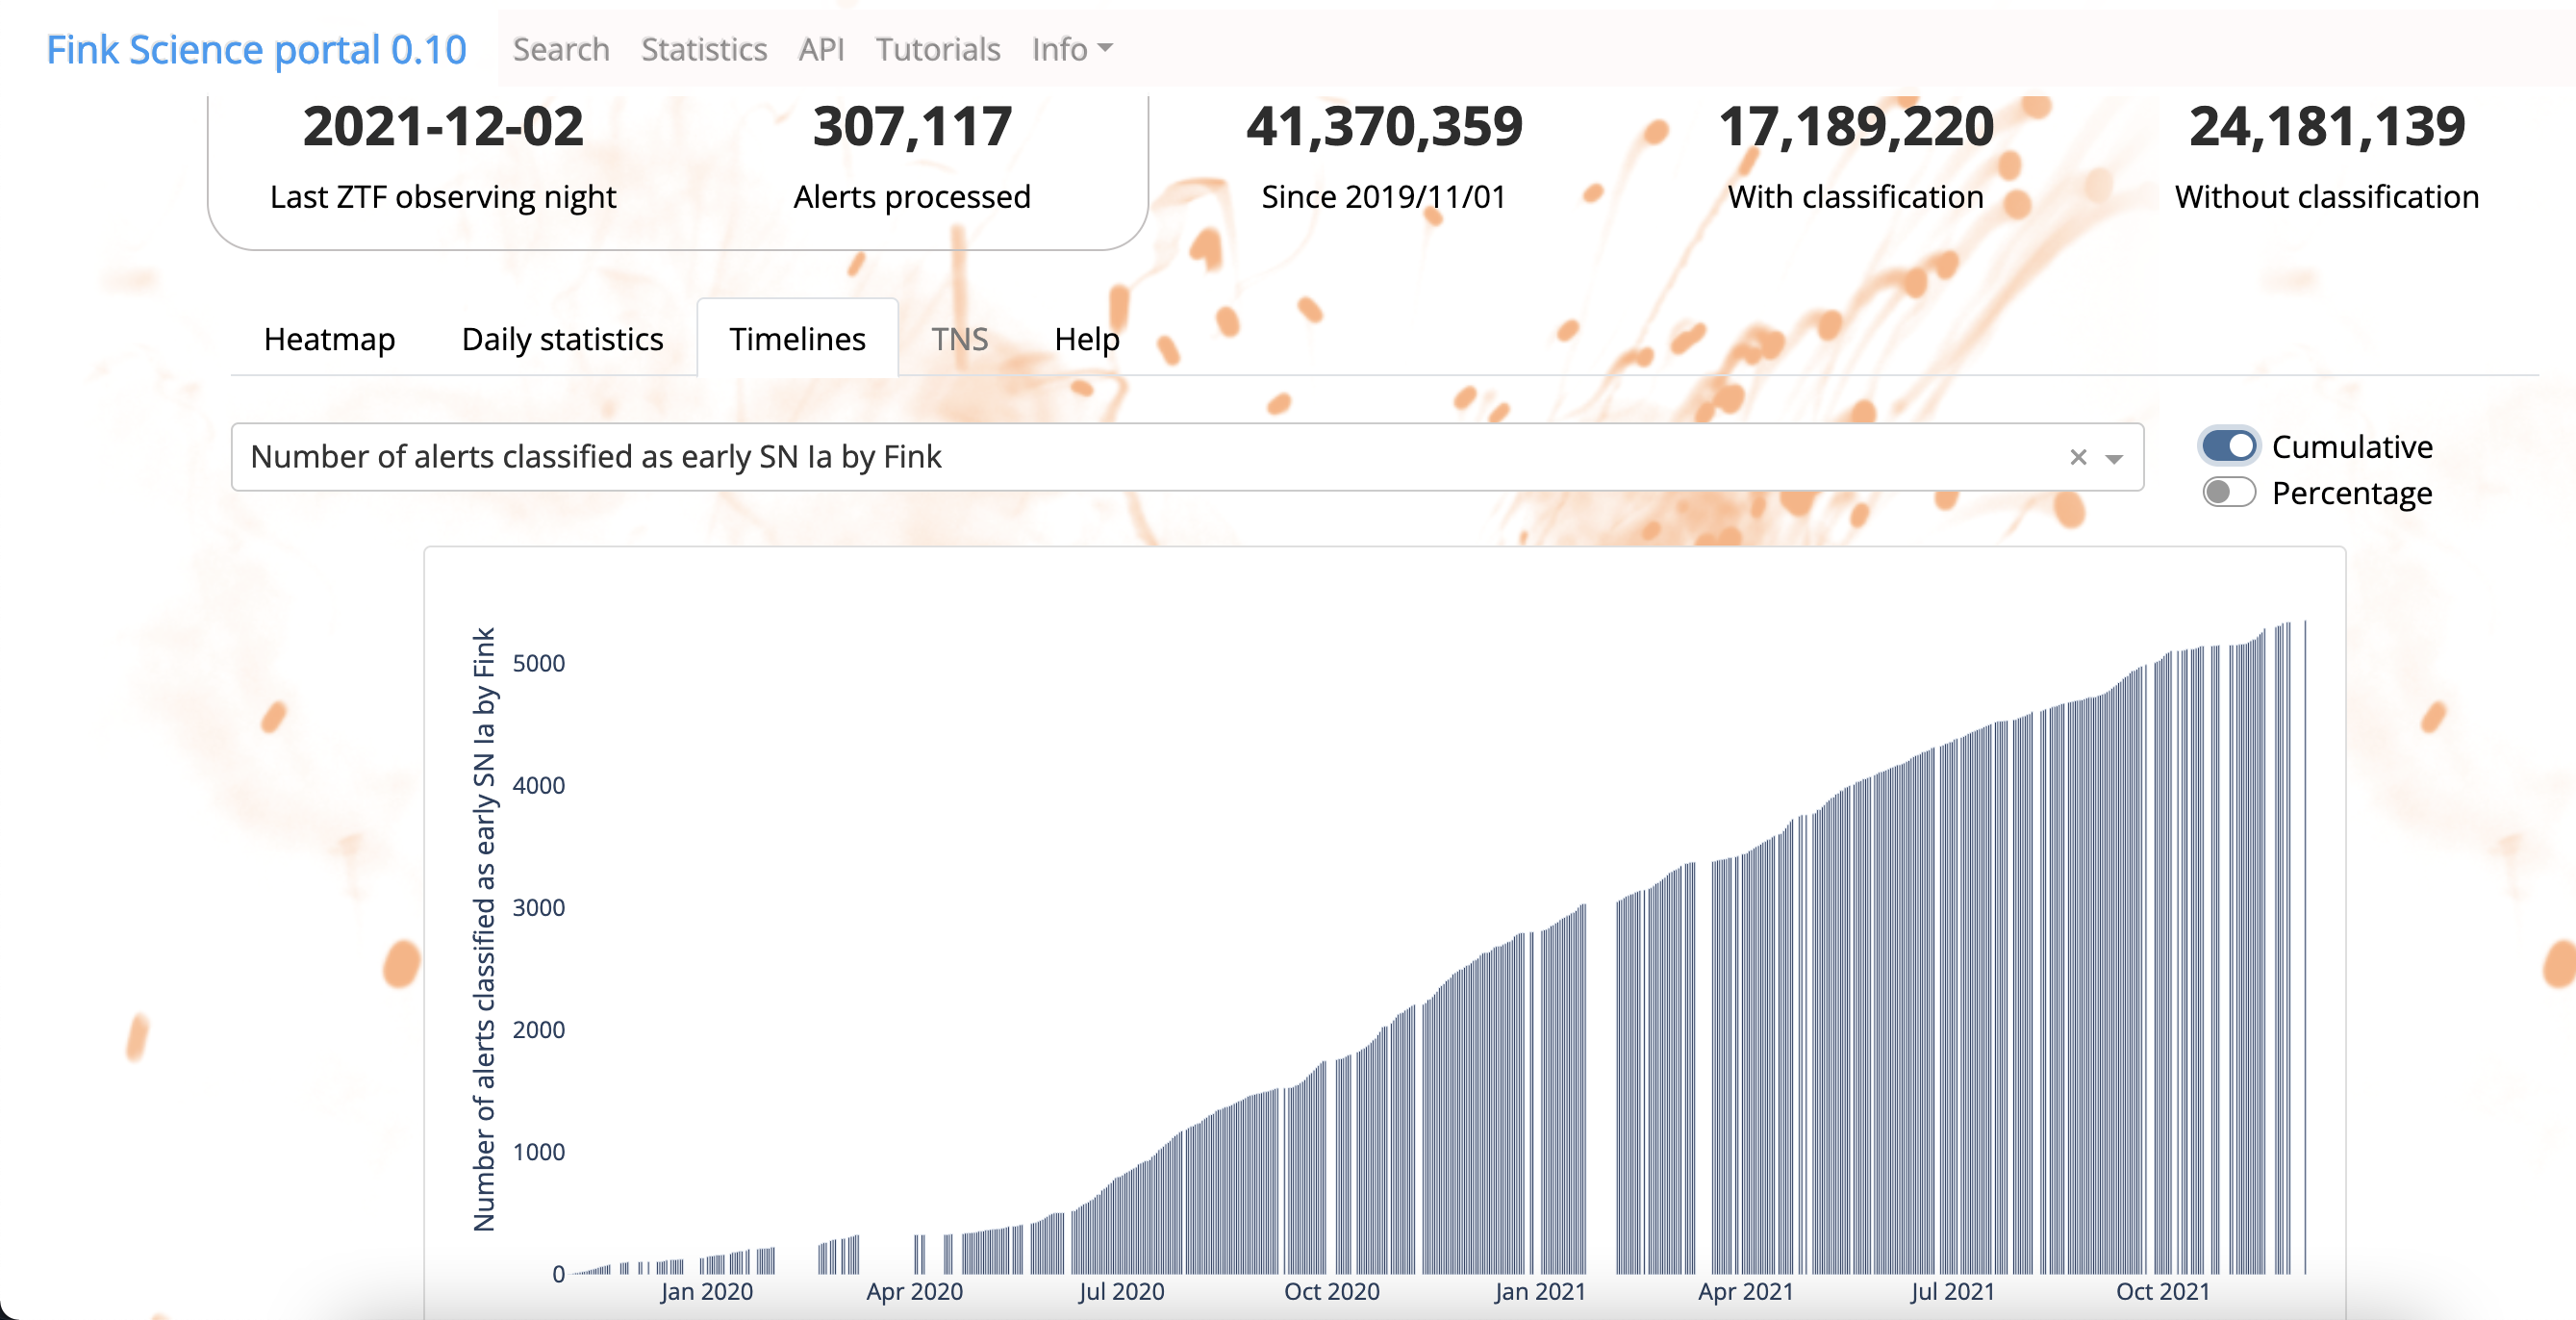
The Timelines tab shows the evolution of several parameters over time. By default, we show the number of
processed alerts per night, since the beginning of operations:
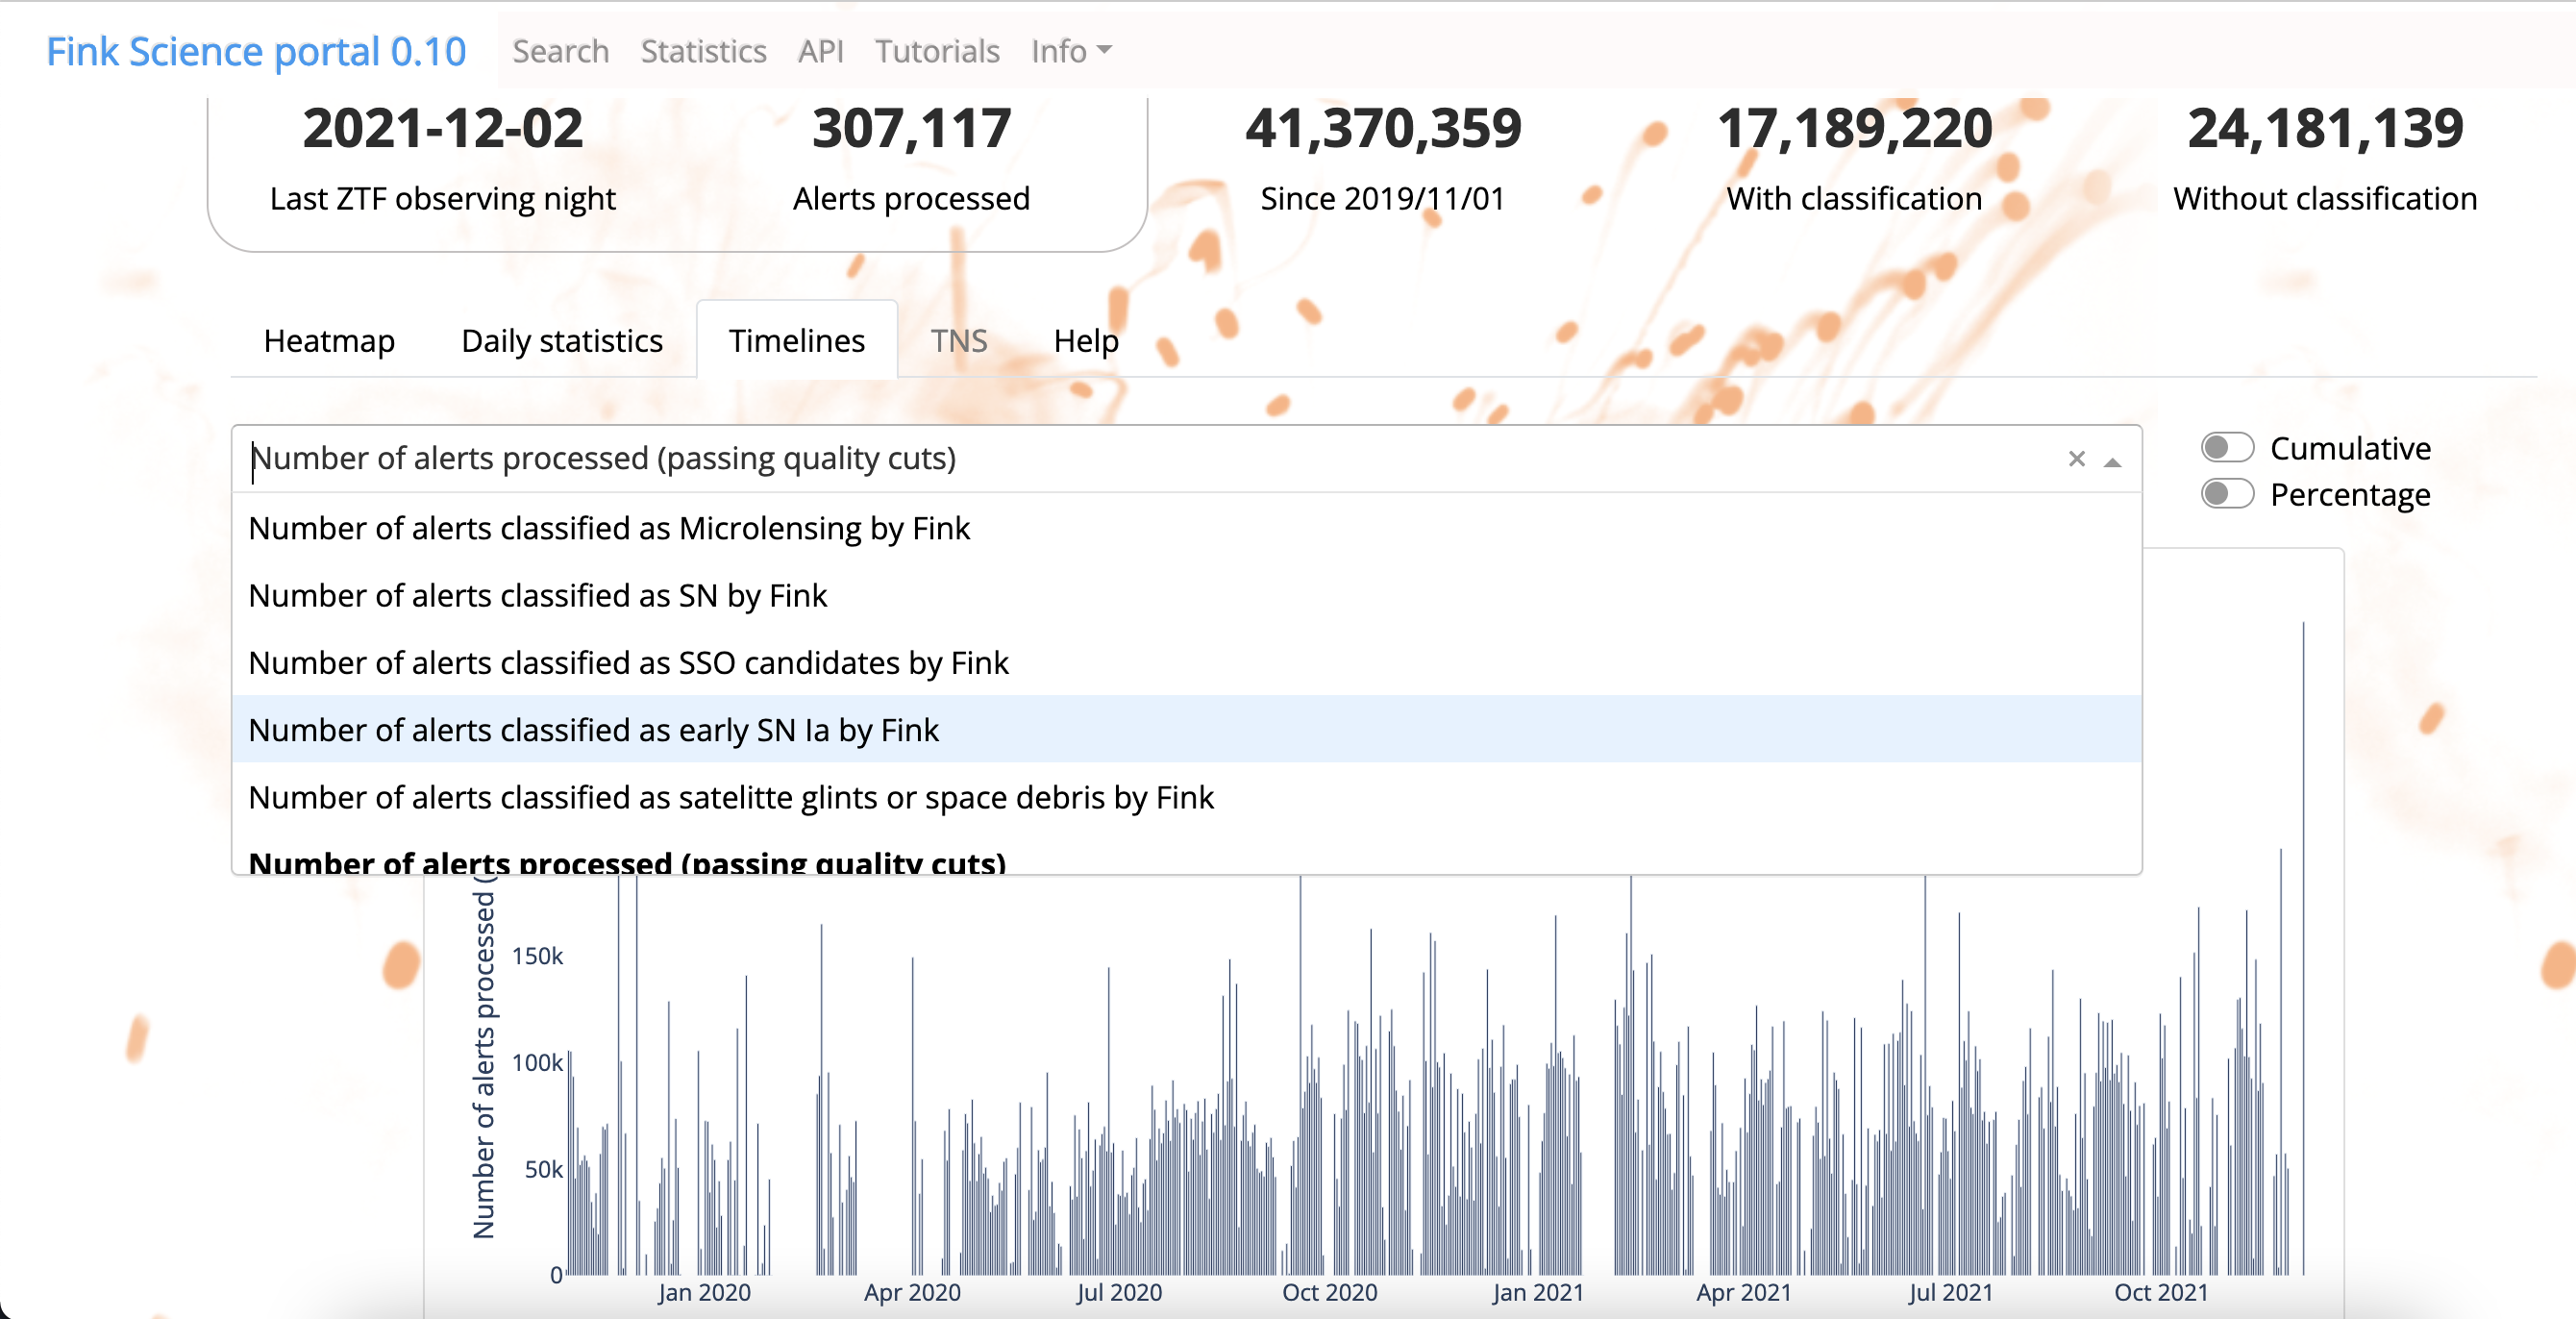
You can change the parameter to show by using the dropdown button:
Note that you can also show the cumulative number of alerts over time by switching the button on the top right :-)
More information about the schema in the Help tab.
Finally, you can display the percentage of each class (with respect to the number of processed alerts) by switching the button Percentage. By combining both Cumulative and Percentage, you will see the evolution of the proportion of each class over time:
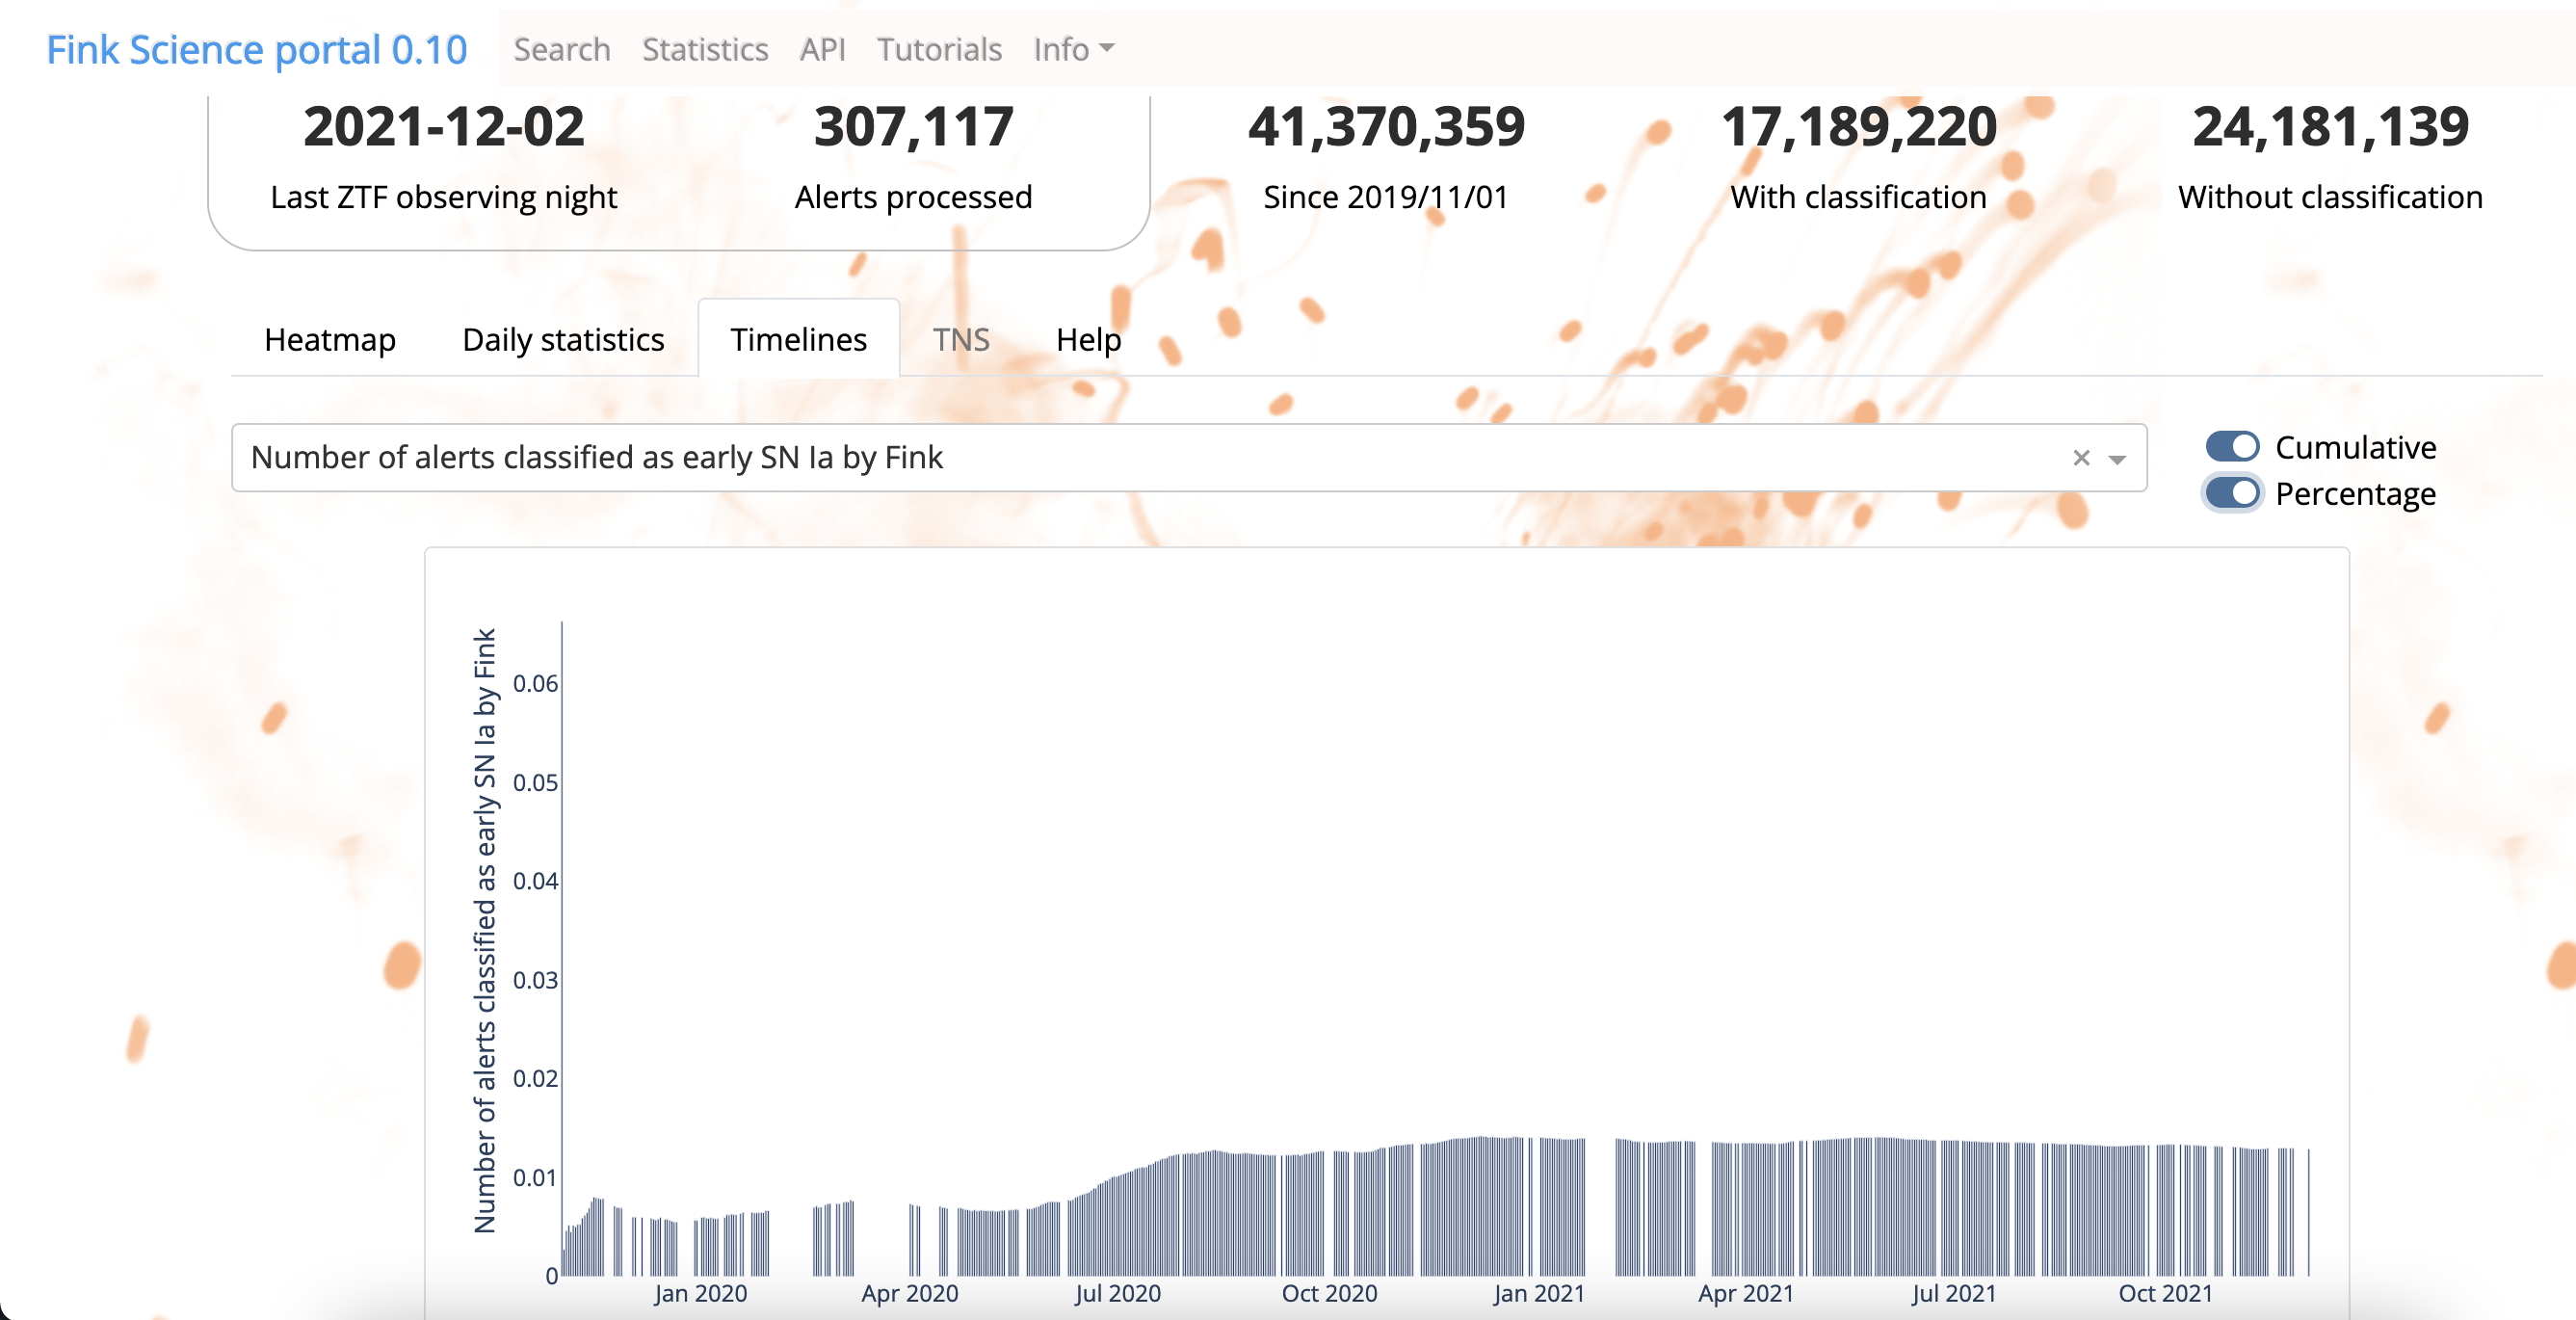 Evolution of the proportion of alerts classified as Early SN Ia as a function of time.
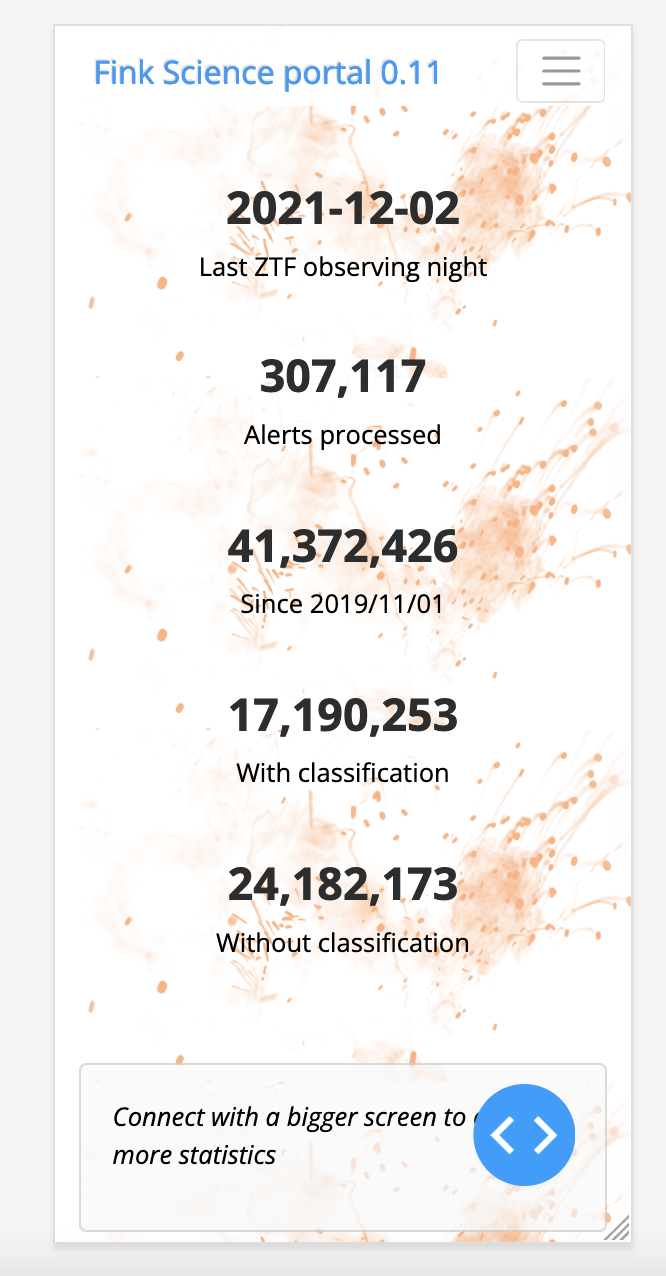
Mobile version
It is rather difficult to display plots and use them on a mobile device. Therefore the mobile version of the statistics page is light, and it contains only the basic statistics from the header:
REST API
If you want to explore more statistics, or create your own dashboard based on Fink data, you can do all of these yourself using the REST API. Here is an example using Python:
import requests
import pandas as pd

# get stats for all the year 2021
r = requests.post(
  'https://fink-portal.org/api/v1/statistics',
  json={{
    'date': '2021',
    'output-format': 'json'
  }}
)

# Format output in a DataFrame
pdf = pd.read_json(r.content)
Note date can be either a given night (YYYYMMDD), month (YYYYMM), year (YYYY), or eveything (empty string). More information about the schema in the Help tab.