Fink Science Portal
Portal
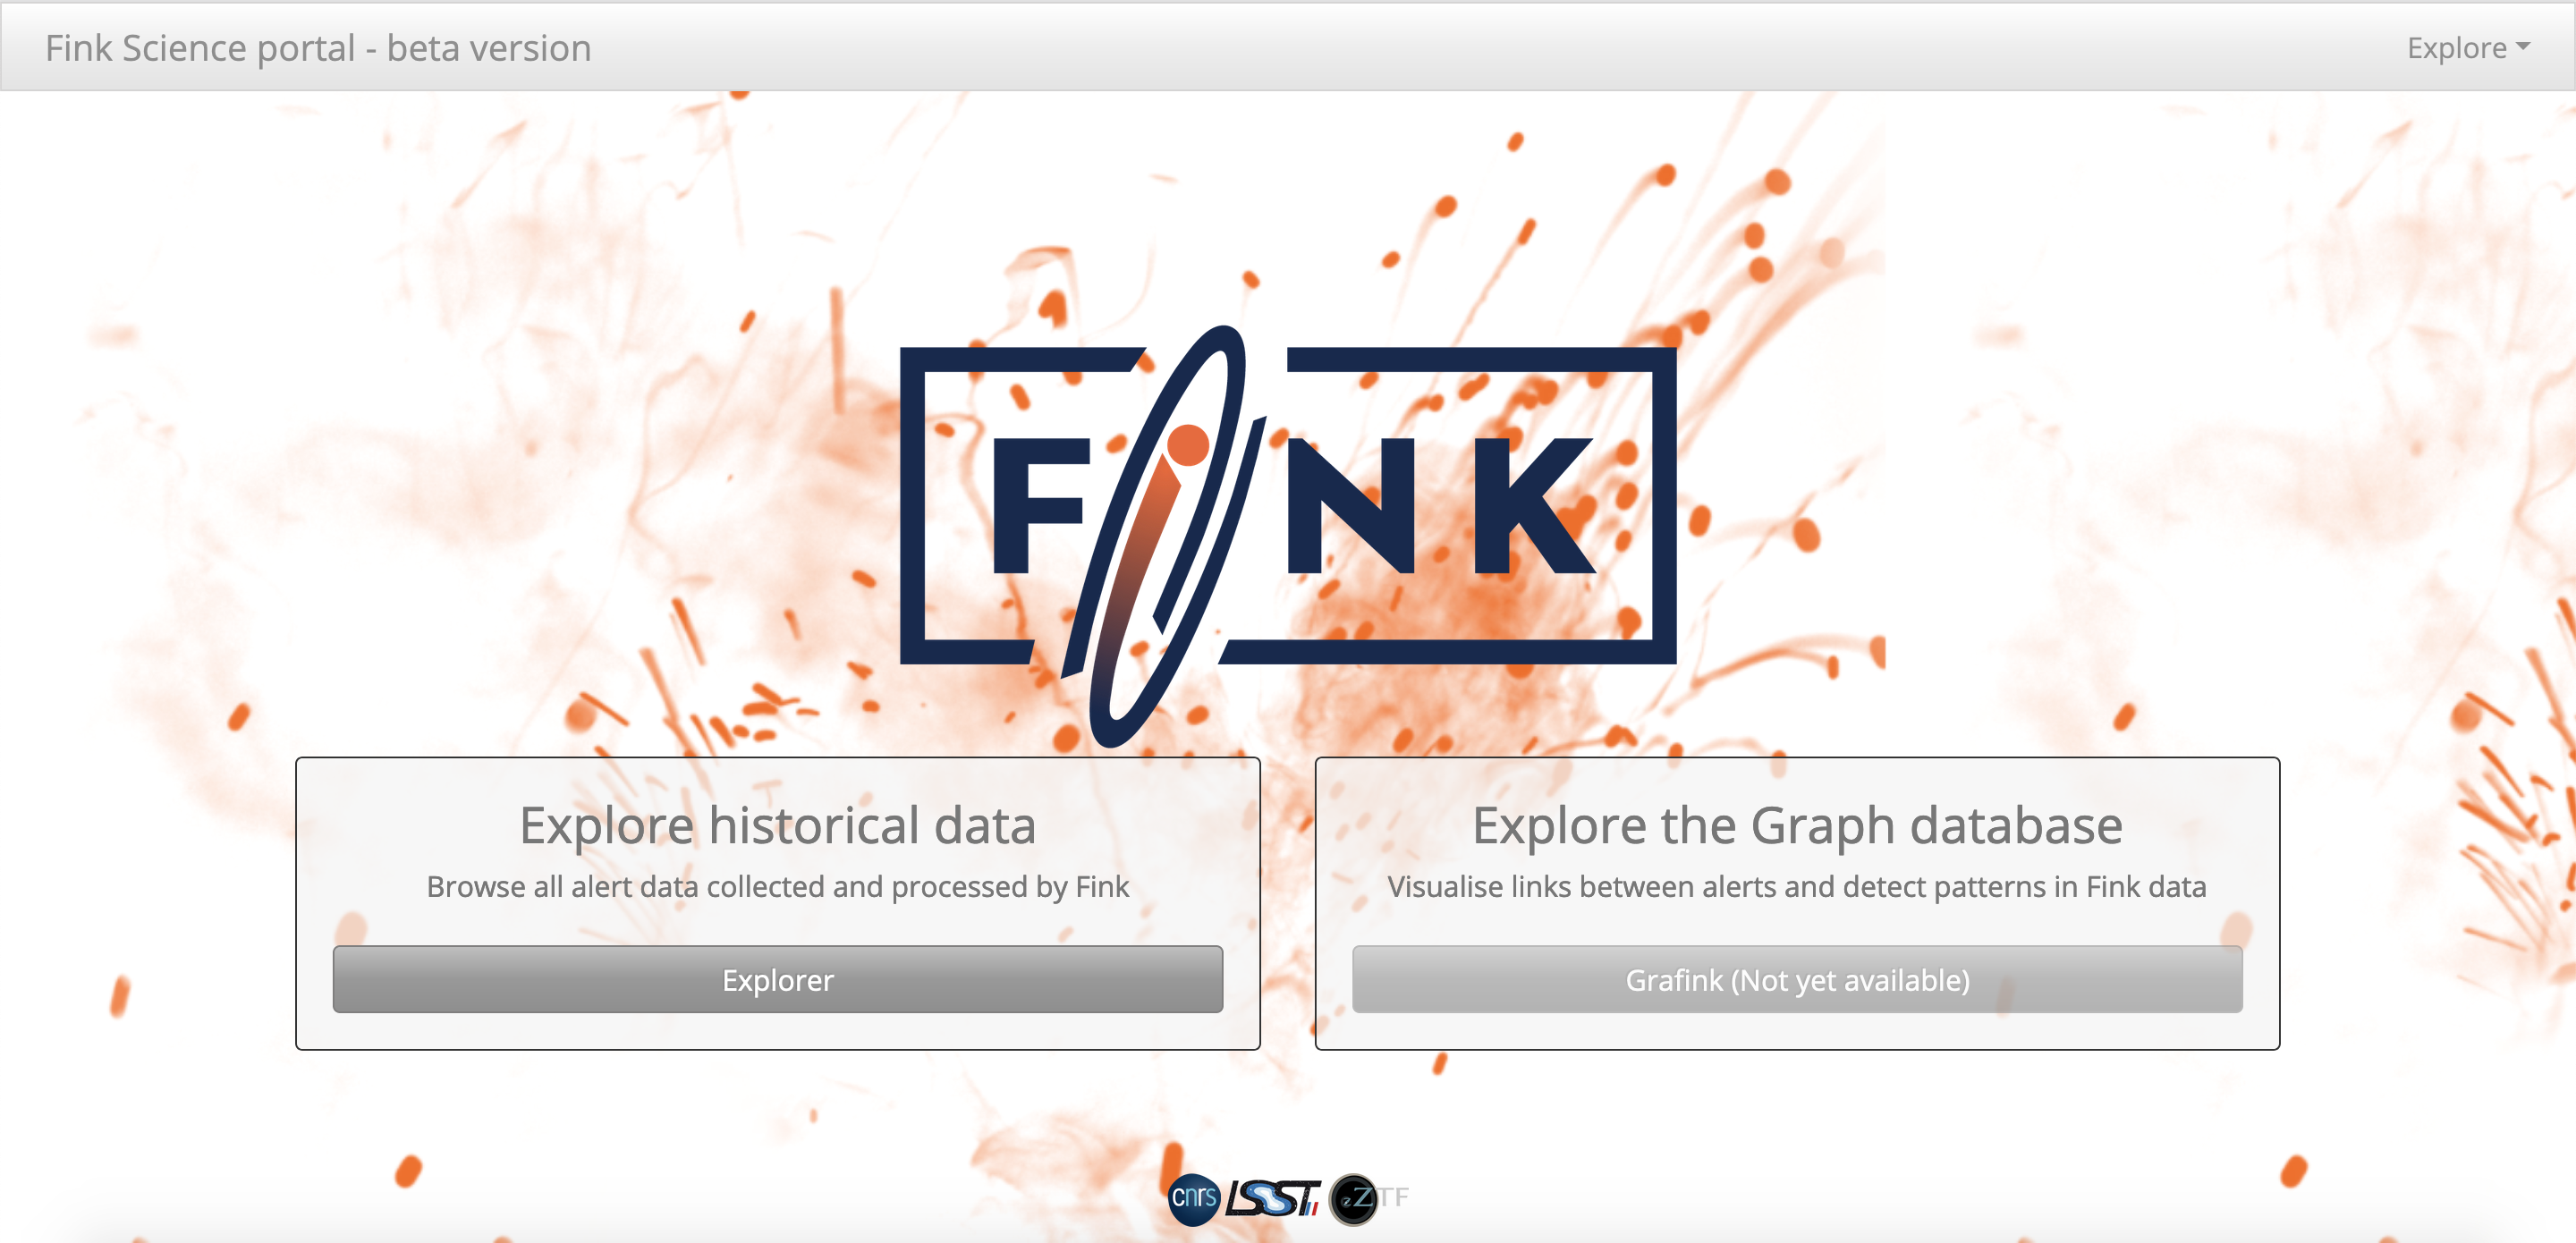
The Fink development team is happy to announce the deployment of the Fink Science Portal!
This service allows users to browse and display alert data collected and processed by Fink from a web browser. The Portal can be accessed from the Fink website: https://fink-broker.org.
 The backend is using Apache HBase, a distributed non-relational database. The frontend is based on Dash, a Python web framework built on top of Flask and React.
What is available?
We pushed ZTF public alert data from 01 November 2019 to now. For the first year of Fink operation (2019-11 to 2020-11), this represents more than 50 million alerts collected (>2 TB), and about 20 million processed (>700 GB). Alerts are aggregated by their objectId, and all alerts contain original ZTF information and Fink added values
Data is updated once a day, after the observing night is over. There is no plan to support streaming updates to HBase, and if you want live information we can provide live Kafka streams instead.
Searching the database
Backend structure
After each observation night, the data is aggregated and pushed into Apache HBase tables. The main table contains all alert data processed by Fink since 2019-11-01, and it is indexed along the objectId of each alert, and the emission date jd.
In order to allow multi-indexing with HBase, we designed index tables. These tables are indexed along different properties (time, sky position, classification, …). They contain the same number of rows than the main table but fewer columns. These index tables are used to perform fast search along arbitrary properties and isolate interesting candidates, while the main table is used to display final data.
Available searches
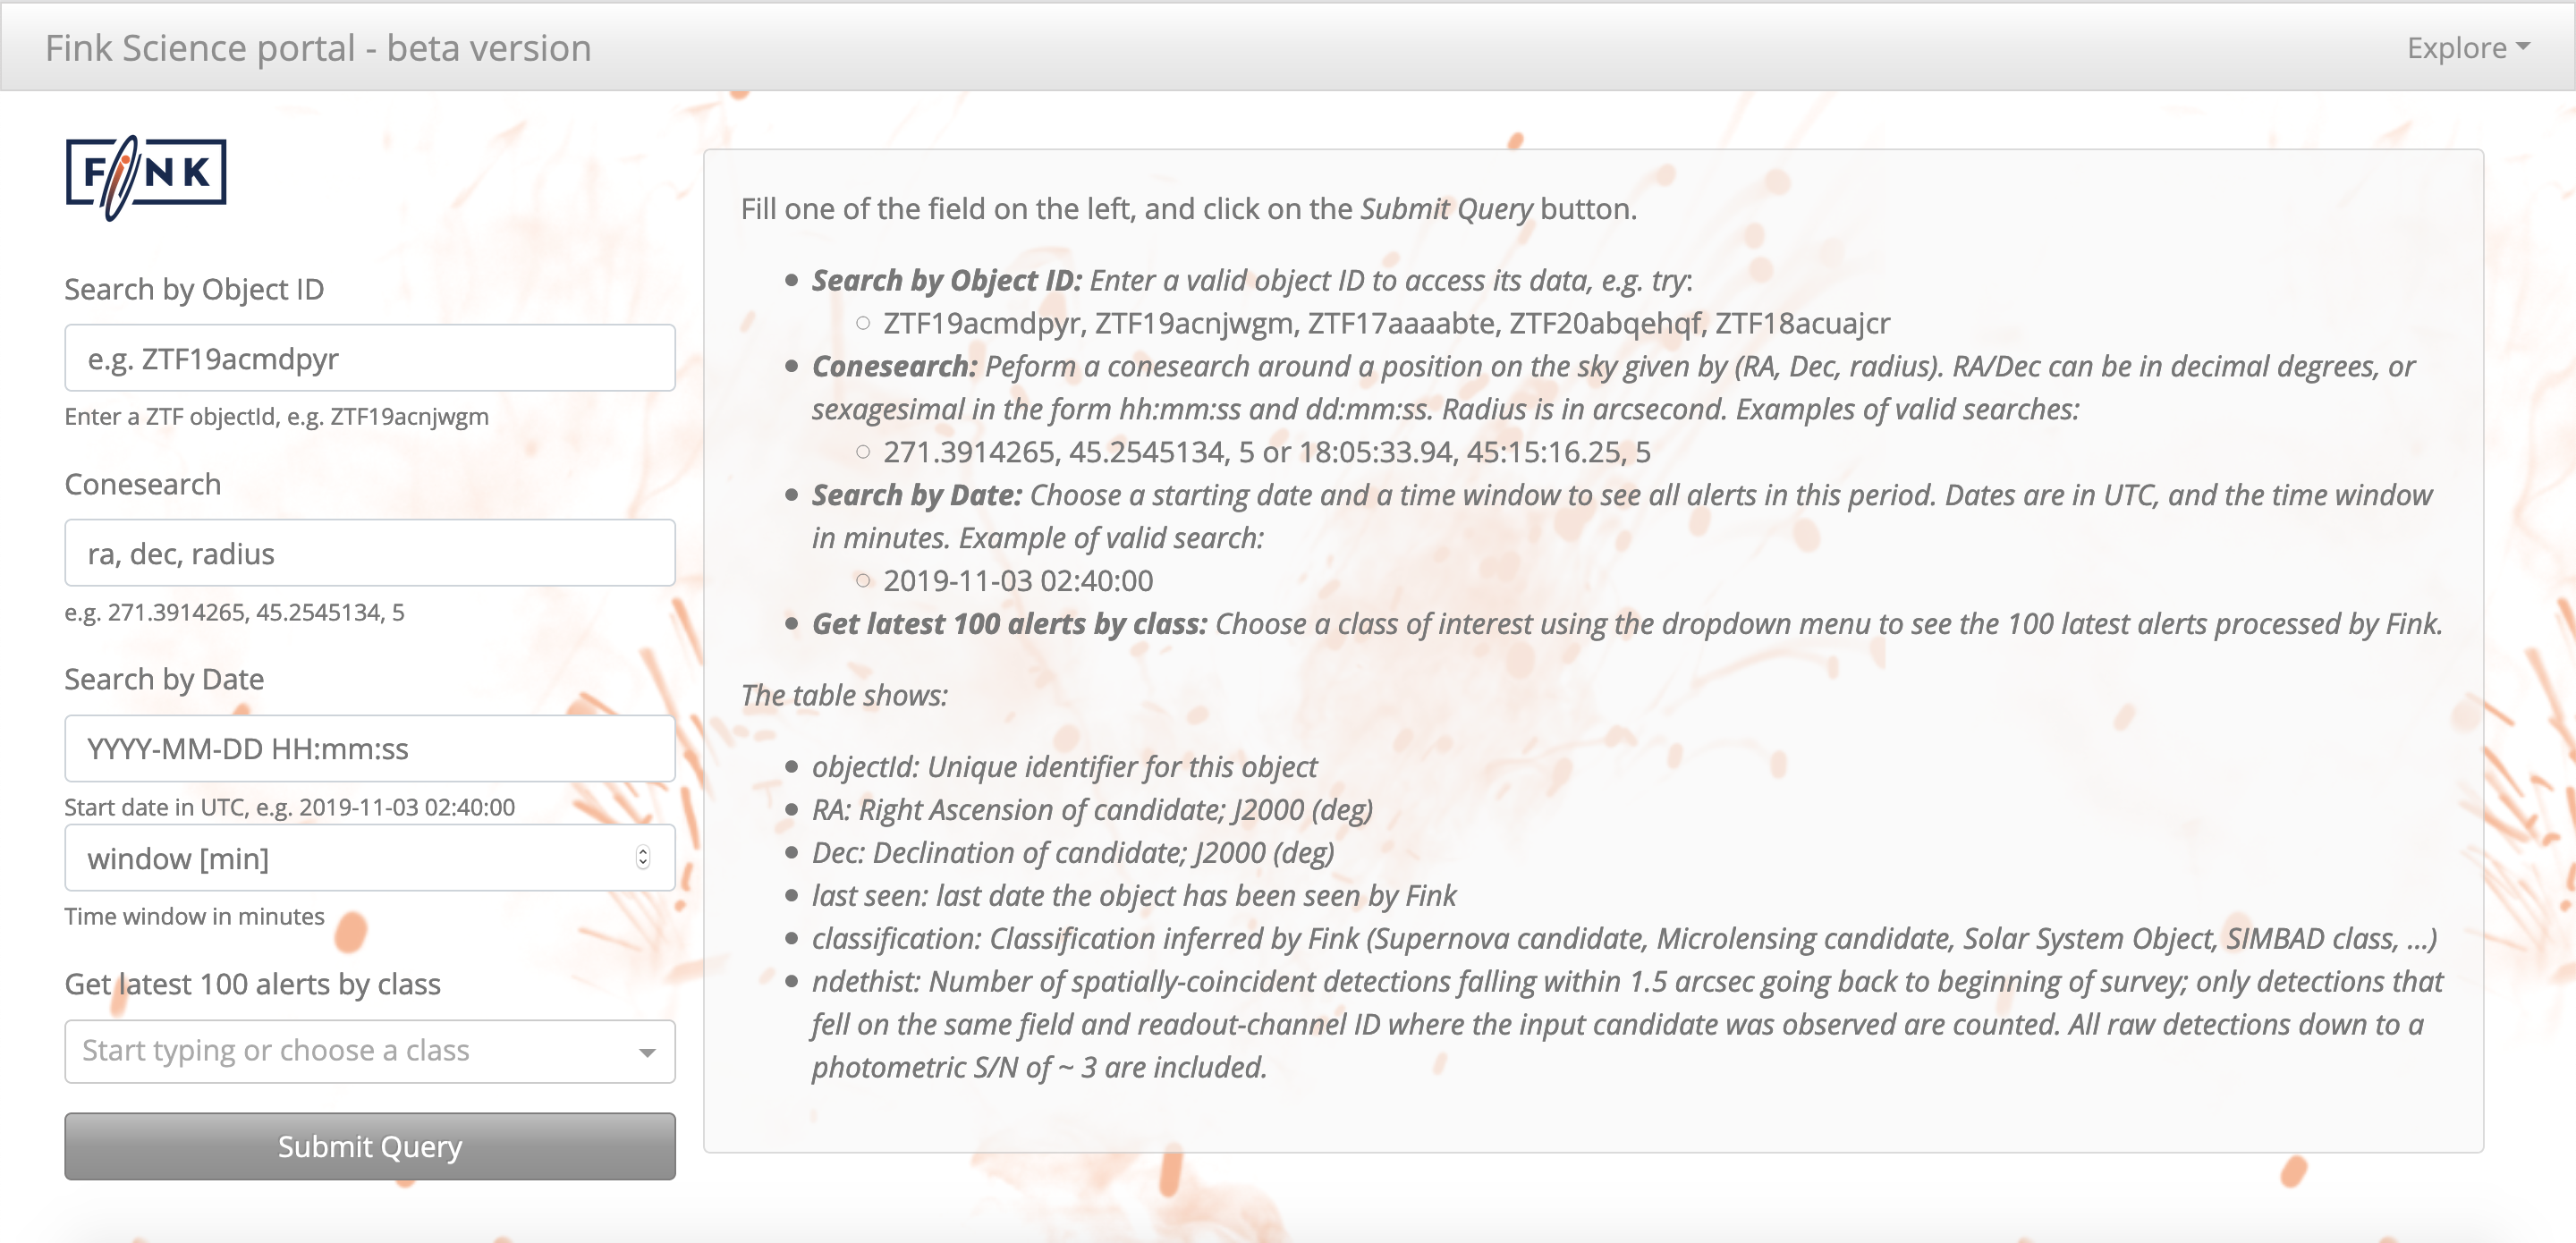
Users can perform different types of search:
- Search by Object ID: Enter a valid object ID to access its data
- Conesearch: Peform a conesearch around a position on the sky given by (RA, Dec, radius). RA/Dec can be in decimal degrees, or sexagesimal in the form hh:mm:ss and dd:mm:ss. Radius is in arcsecond.
- Search by Date: Choose a starting date and a time window to see all alerts in this period. Dates are in UTC, and the time window in minutes.
- Get latest 100 alerts by class: Choose a class of interest using the dropdown menu to see the 100 latest alerts processed by Fink.
For now, users cannot combine searches, but we are working hard to allow it. Stay tuned!
The power of the views!
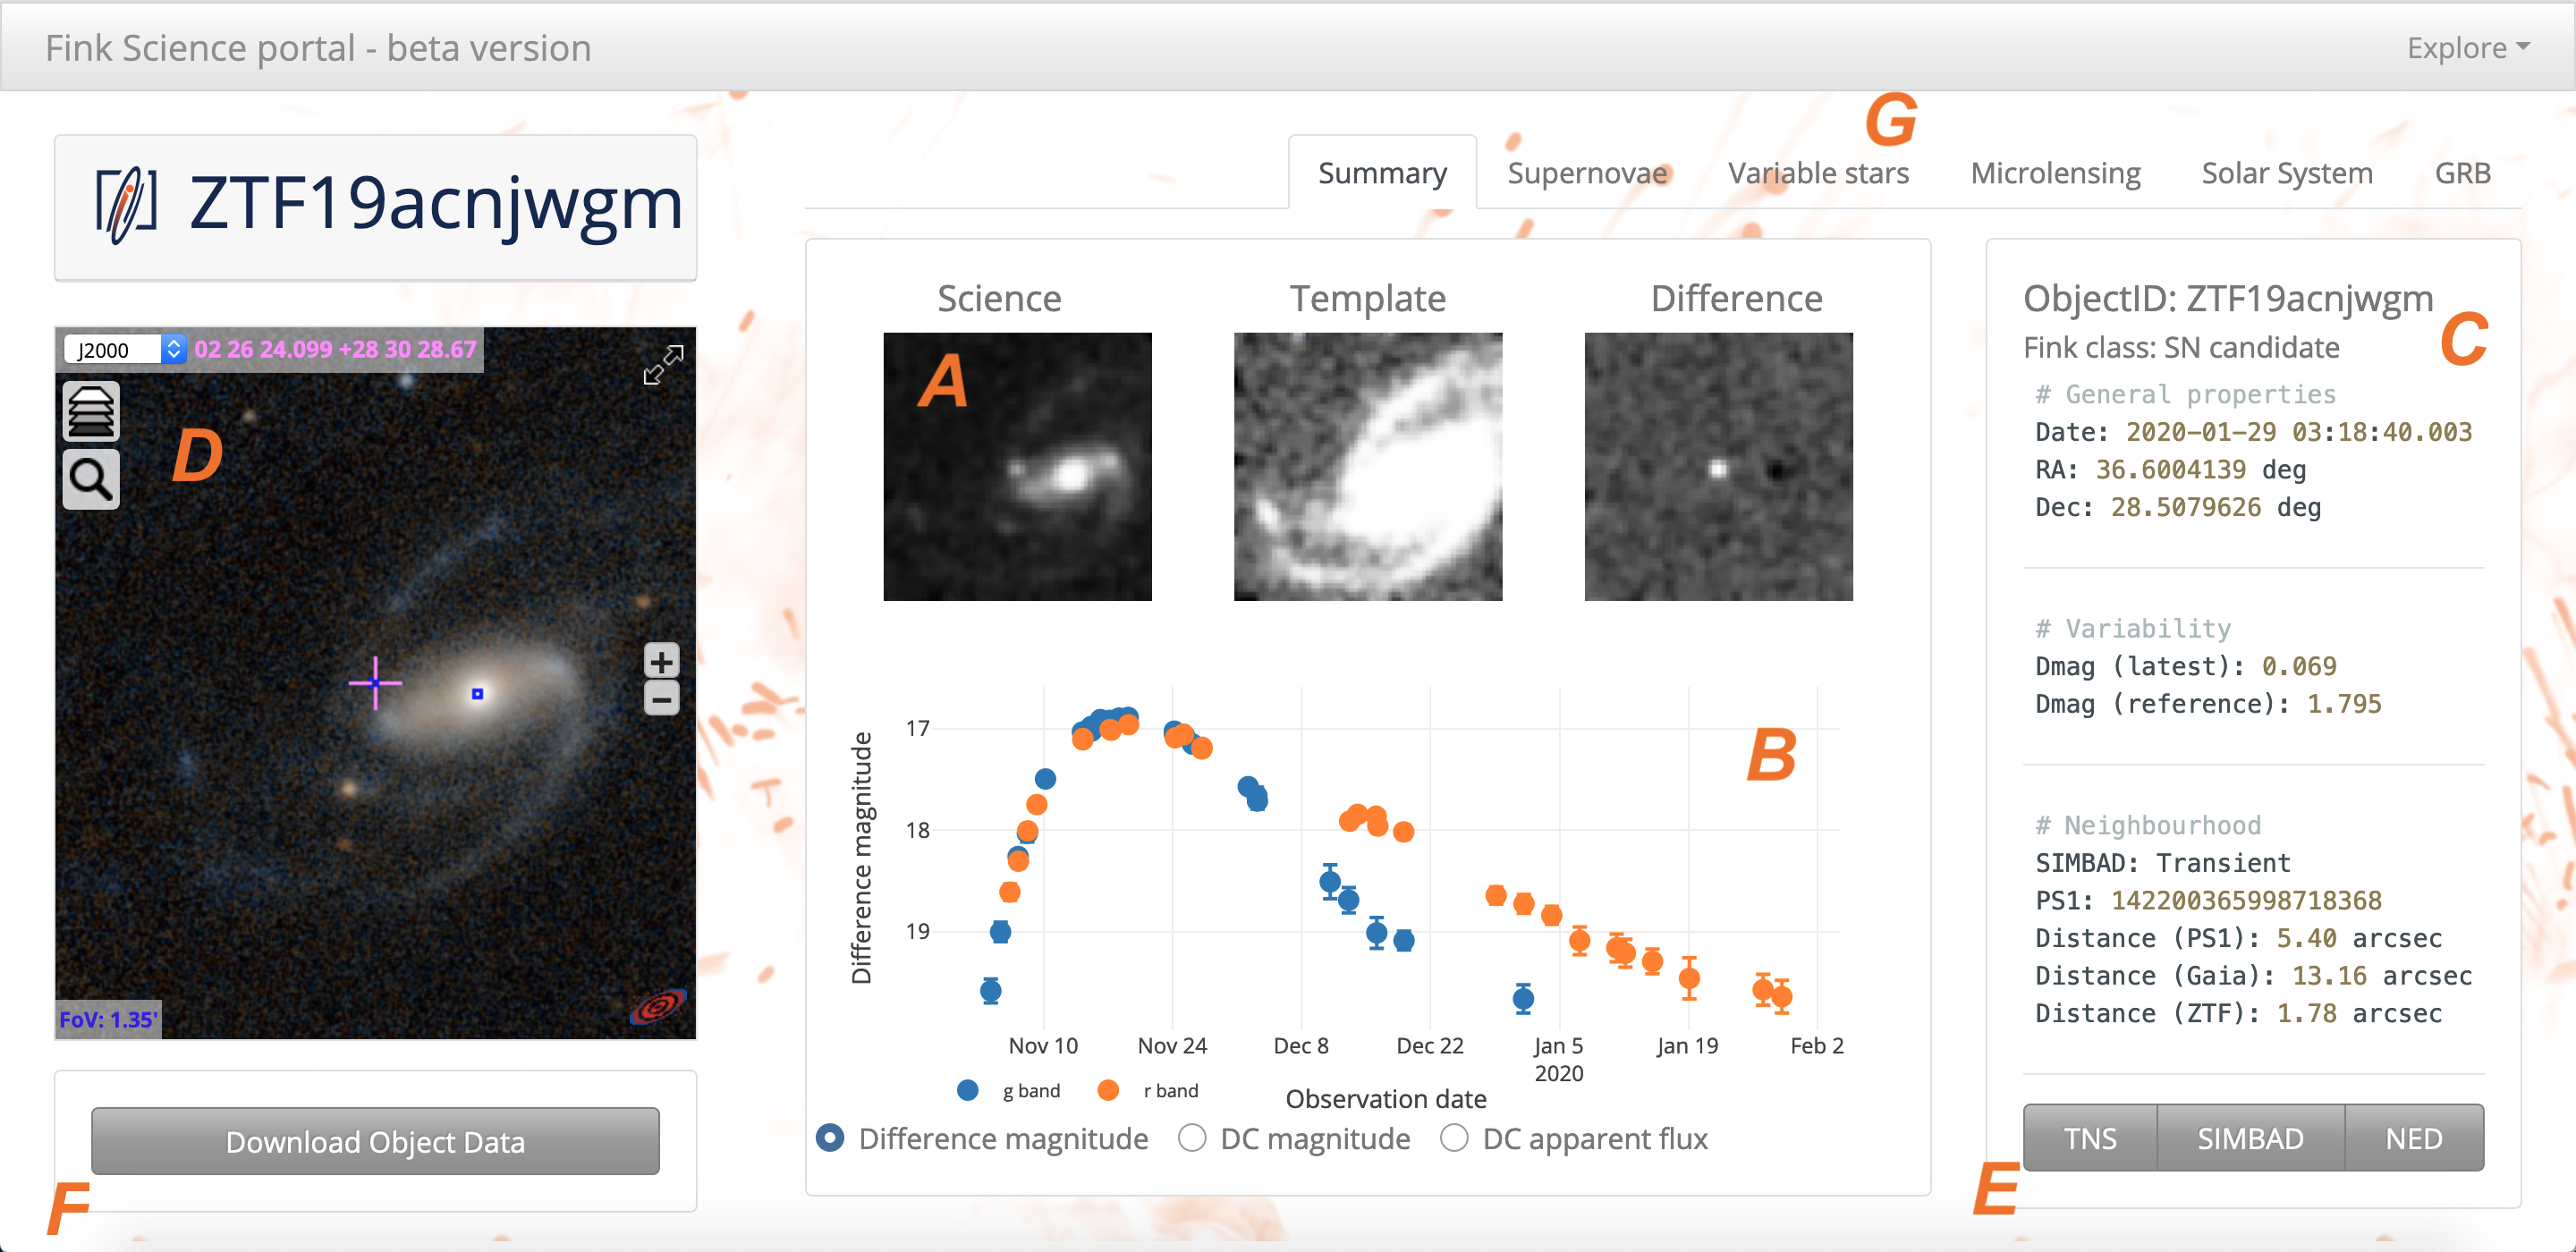 The Fink object page summary from the beta version of the science portal. A: Cutouts from the last alert packet of this object. B: Complete light-curve of the object. The users can change units to display difference magnitude, DC magnitude, or DC apparent flux as a function of time. Filter bands are shown in different colours. C: Textual information from the last alert, such as its emission date, sky position, light variability with respect to the previous alert, or the closest sources from external catalogues (PanSTARRS-DR1, Gaia-DR2, ZTF). D: Interactive Aladin view of the object with the PanSTARRS-DR1 image centred at the position of the latest alert. E: External online data-sets (TNS, SIMBAD, NED) with cross-matched data to this object (e.g. spectroscopy). F: Button to download object data (all annotated data for this object). G: Tabs to trigger different views of the object. The views focus on specific aspect of the data (such as the evolution of classification module scores for Supernovae detection) and the users can perform data fit based on pre-loaded models (e.g. variable stars, microlensing). New features and new views are regularly added based on our community feedback. As of November 2020, the Science Portal gives access to more than 15 million ZTF alerts processed by Fink.
The scientific interest of the Fink community is wide: supernovae, microlensing, multi-messenger astronomy, solar system objects… and it is difficult to give all information in one page for everyone. Hence, we developed views to explore particular aspect of each alert. By default, you will have a summary view of the object (cutouts, lightcurve, some textual information…). Then you can click on different tabs that will show different information based on a science topic: supernovae (e.g. classification score evolution), variable stars (fit using gatspy), microlensing (fit using pyLIMA), …
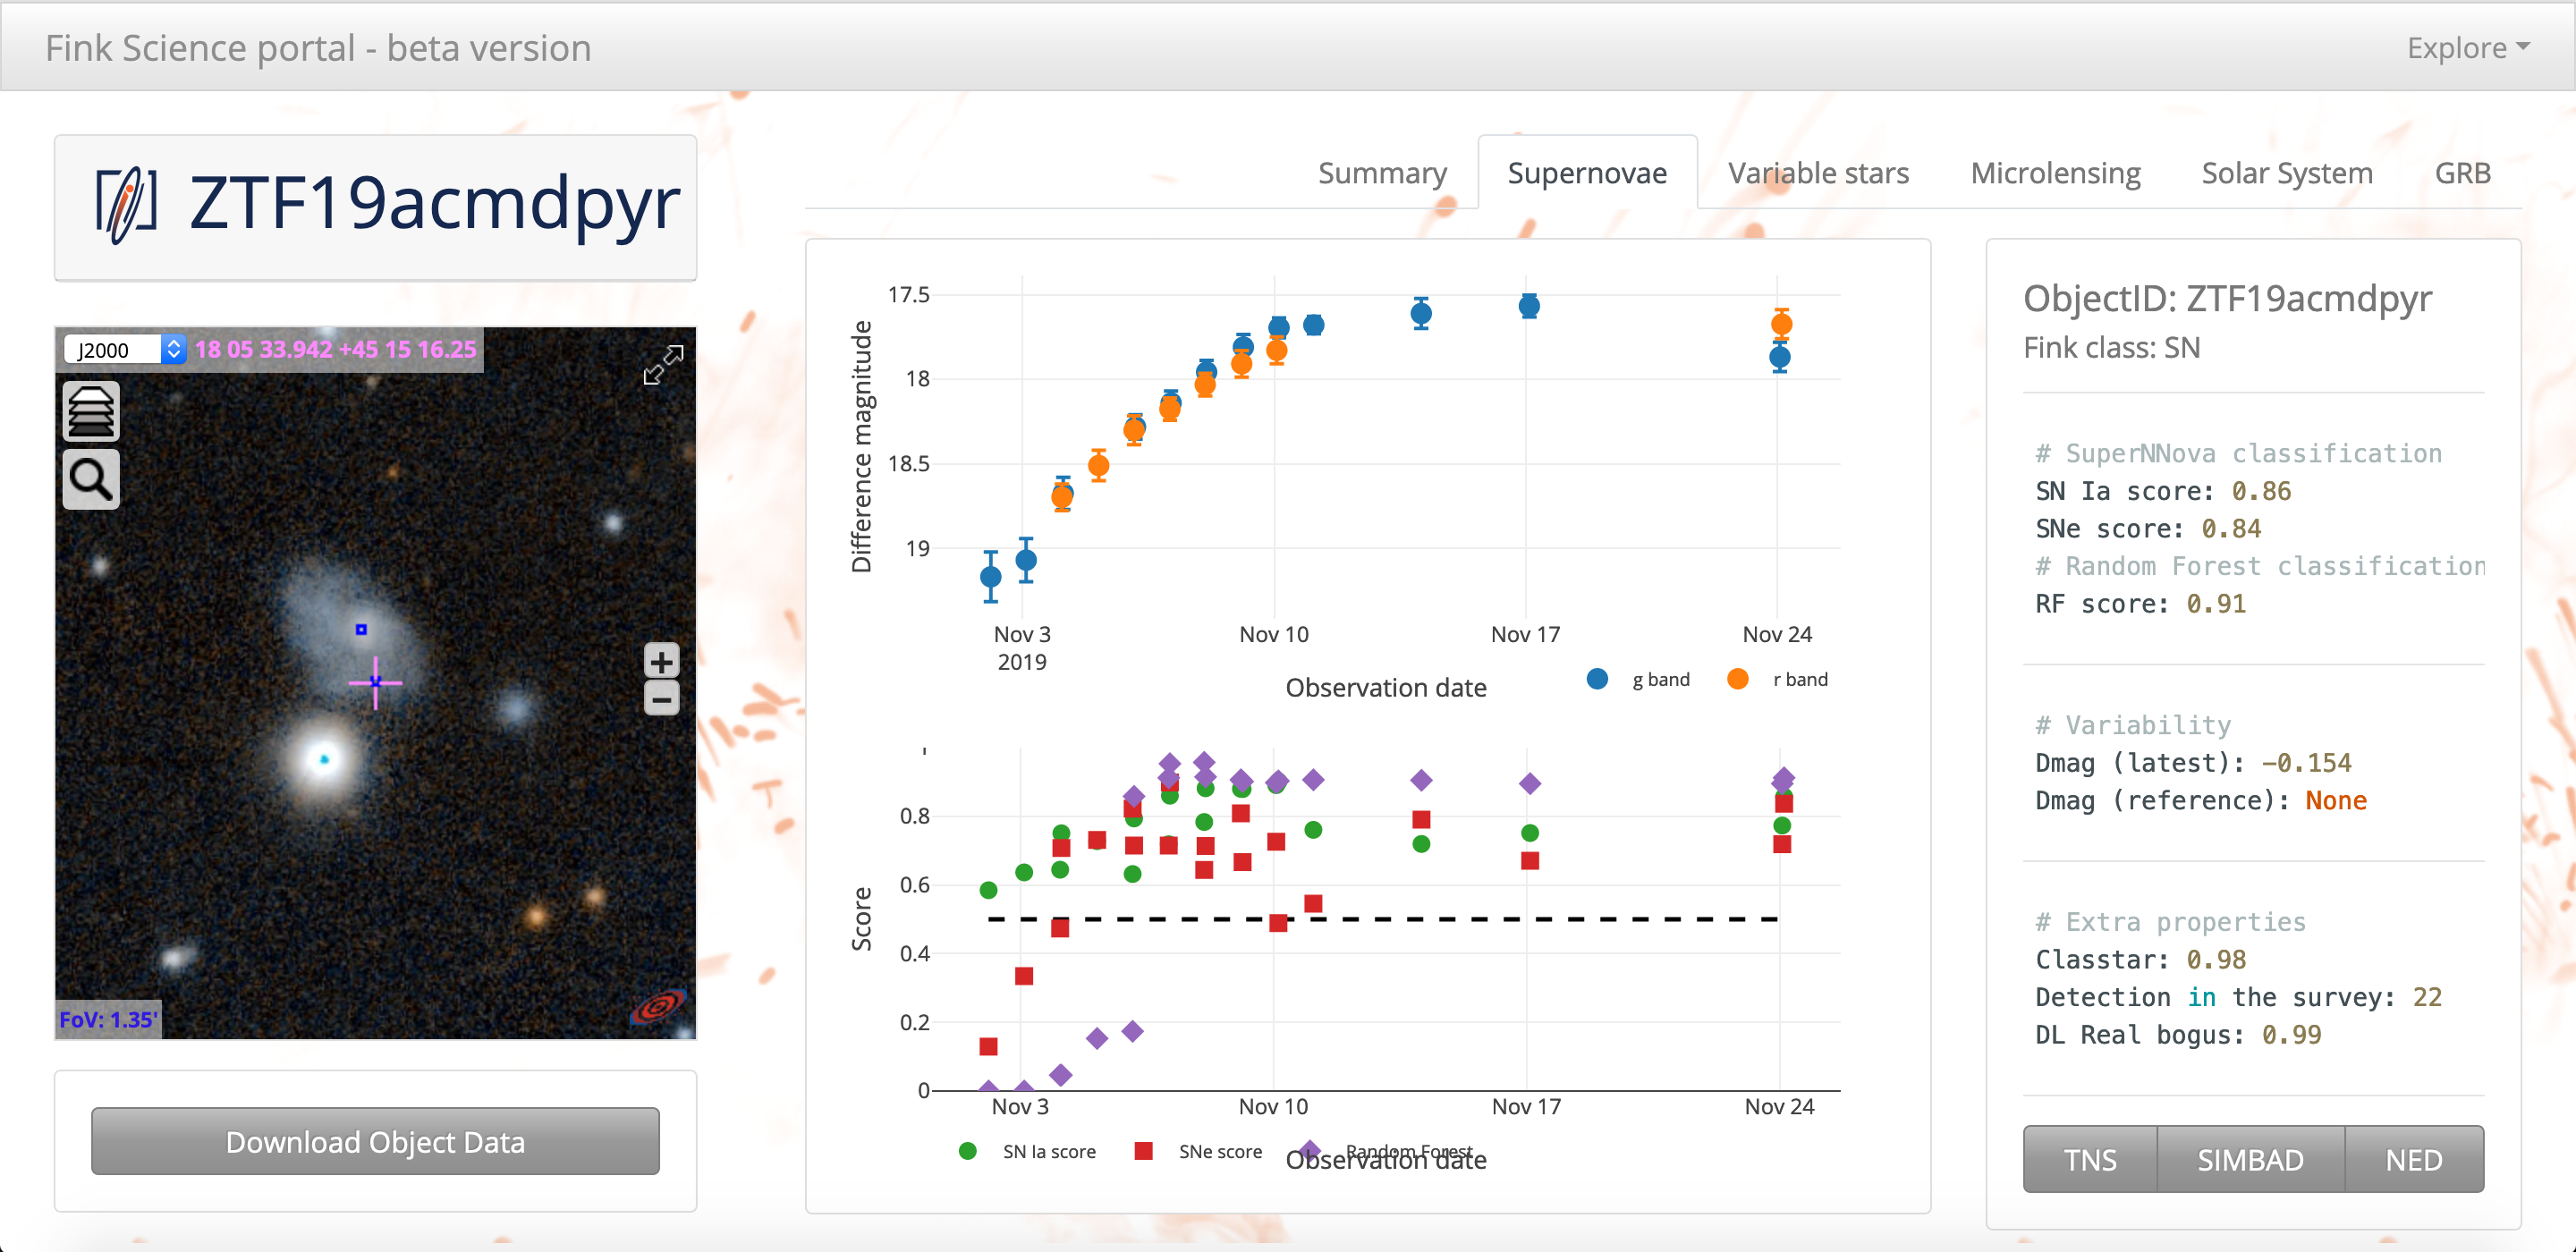 Example of a view: supernovae. The view shows the classification score evolution from the different machine learning modules in Fink such as the scores from SuperNNova, an open source supernova photometric classification framework. You have also additional information from the alert shown on the right that can help to disentangle between a supernova and other types.
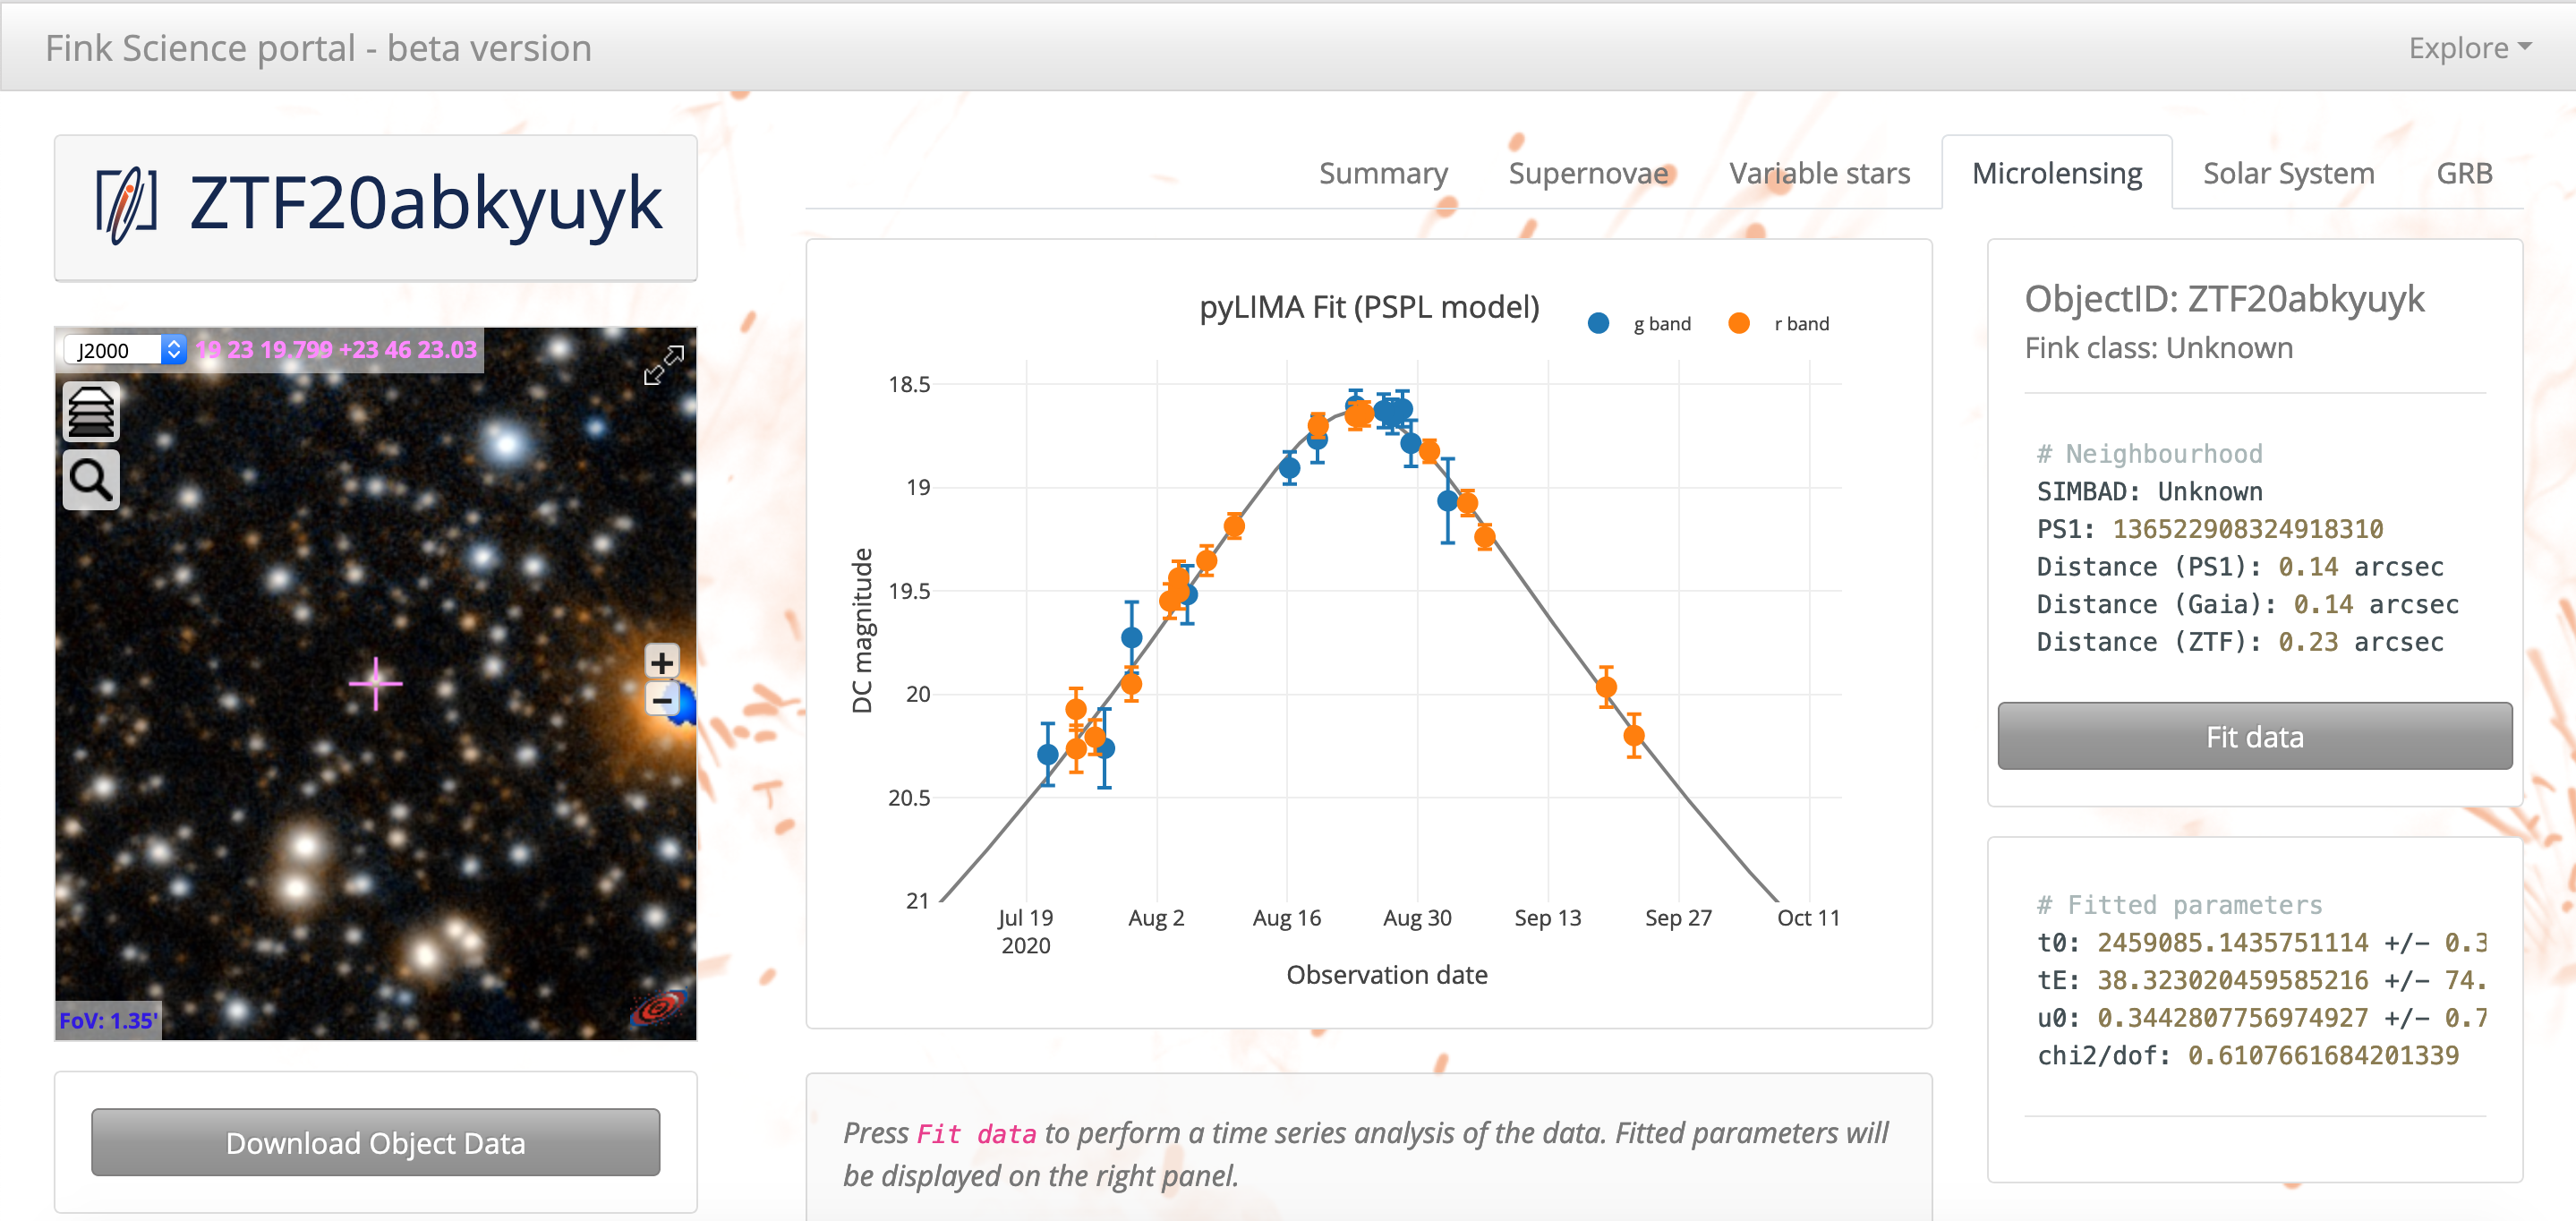 Example of a view: microlensing. The view allows to use pyLIMA, an open source code, for modeling microlensing events. The user can fit for the data, and inspect fitted parameters.
More views are in preparation: Gamma Ray Bursts with the SVOM team, Solar System objects, and we would like to hear your ideas for new views!
Community feedback & enrichment
This first version of the Portal contains only limited features, but it is extremely flexible. Things we would like to hear from you:
- Is it useful for your research?
- Are there things wrong? (classification, fit, …)
- Are there things not working? (slowness, bugs, …)
- What could be improved? (documentation, display, …)
- What would you like to have? (new views, different information inside a view, …)
We encourage users to send their feedback to the team (#scienceportal channel in the Fink Slack workspace, or by email at contact@fink-broker.org). Note that in the next month, the server might be unavailable often (crash, updates, etc.).
Client and public API
We developed custom HBase clients to manipulate the data efficiently (more information at Lomikel or FinkBrowser). The data itself is not directly publicly accessible for security reasons, and we are now constructing the public API service to enable a seamless user experience and enable automatising follow-up coordination with observational facilities and teams.
Note that the Science Portal is not the place to perform heavy computations. Instead, there will be the Fink Science Platform launched later (expected Q1 2021), with notebooks available on-demand, and connected to the Fink dataset.
Stay tuned!
Julius Hrivnac, Sacha Pateyron, Julien Peloton (IJCLab)